Total Pageviews

Sunday, December 30, 2012

Nifty-inversion-of-waves-over-3-years

Further to my observations in my earlier blog :

http://lalitlk-lalit-lk.blogspot.in/2012/06/nifty-inversion-of-waves-over-2-years.html

I shall like to review the Nifty Chart over the last three years which is :


Image from the chart January 2010 to 05/08/11 was,as per attachment  


was inverted 180 degree( anti-clockwise) and  the  'Inverted Chart' is being shown along with Chart for the period of 05/08/2011 to year end in the following chart with prominent 'pattern similarity' marked A to H. 
Chart beyond H, in the inverted one,  is yet to play out & looks favoring the bears.


.

I went back by one year and similarly inverted that chart from January 2009 & resulted charted was labelled H & thereafter the boxed area is YET TO PLAY OUT. If the hypothesis comes TRUE, it has so far done PATTERN WISE, Nifty is due for a DIP in recent time & then scale NEW HIGH.


Let us cross our fingers to check if these hypothesis comes true or not.

Wednesday, December 19, 2012

Vardhman-acrylics-buy-back: Up date 19/12/2012

Further to my observations

http://lalitlk-lalit-lk.blogspot.in/2012/11/vardhman-acrylics-buy-back-creating.html

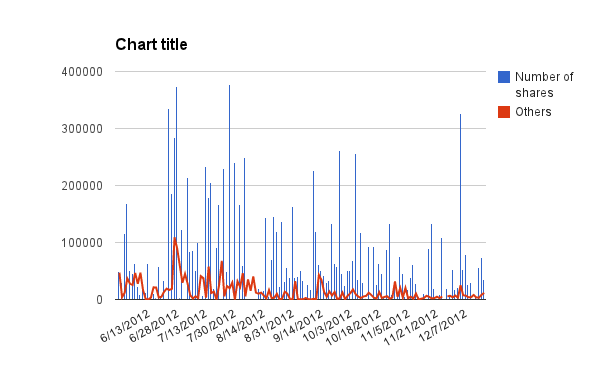
Slowly and steadily the management has picked up all most half of the targeted  two crore shares. IMHO, even if the price is raised to Rs. 12.50 , they may not achieve the target. Progress so far is summarised

Qty range      No of Days       Total        Average (daily)
0-50 K 72 days 1312443 18228.38
50001-1 Lakh 31 days 2062068 66518.32
100001-2 Lakh 18 days 2659038 147724.3
200001-4 Lakh 14 days 3813852 272418
Total 9847401

Buy Back is in Blue while other delivered received by others in Red.
Bye the way, book value of the Company for residual shareholders  is getting enhanced as the buy back rate is below exiting book value by over seven rupees.

Friday, November 2, 2012

Vardhman Acrylics: Buy back creating wealth


Contrary to my observations
http://lalitlk-lalit-lk.blogspot.com/2012/06/vardhman-acrylics-buy-back-is-destined.html

Significantly,  2,67,86,566 shares (out of 7,40,67,987 shares delivered during 01/04/2010 & 12/06/2012) were traded in the price range of Rs. 12 or lower


Even then Company managed to cross 85 lakh shares in their open market buy back with out price reaching 12 rupee mark showing absolute lack of confidence in the Oswal management.

As on 30th September 2012, there is change in shareholders profile as summarised below:

20 Bodies Corporate disinvested 27,80,337 shares,

818 Individuals (with  9999 or less shares)  disinvested 13,42,407 shares 

69 Individuals (with  10000 or more shares)  disinvested 26,62,878 shares

6 NRIndividuals   disinvested 37,811 shares  

1 Trust invested  5,000 shares 

As on 2nd November 2012, a total of  85,20,231 shares were acquired well below 12 rupees mark & in the process created wealth (conservatively estimated at rs. 8.5 crores)  for residual shareholders (mainly Oswal holding 6,45,70,362 shares) (Percentage being increased from 59.49 to 64.57) as the cost of acquisition is below book value.


Tuesday, September 4, 2012

Chart Data Preparation For Bonus/Split

Stock exchange archive data without any adjustment following issue of either bonus share or splitting of face value. For such cases, it is required to make adjustment in the downloaded DATA. First, save data from the SE in an excel file calling it "SE_DATA" sheet. Secondly, copy appropriate columns such as OHLC & Volume in another sheet calling it "Chart" sheet. 


Adjustment factor which is such that parity before the ex-date is restored; in case of 2:1 bonus issue, historical prices before bonus issue (in BLUE high lighted area) are divided by 3. For these all cells in the last row (in sheet named "Chart(Historical)" before the ex-date) are to be revised (using "F2" option in Excel ) and then copy/paste over the data range. Data are to be updated in "SE_DATA" sheet only & last row in the Chart(Historical) sheet are to be copied & pasted in next row and final Chart is to be generated from these sheet.

Monday, August 6, 2012

Reliance Industries : Progress in Buy Back

In the open market buy back by Reliance Industries, the budget of Rs. 10,440 crores allows a purchase of 12 crores shares @ 870 (maximum rate) & the last date is the 19th January 2013. In the past six months, the buy  back carried out may be summarised  in the following Table:

Month
High
Low
Tot_BB
Tot_Delivery
RATIO
February
851.25
794.49
545000
21140226
2.58
March
807.58
725.25
3657683
39371078
9.29
April
747.85
732.04
2989779
18061568
16.55
May
744.64
676.94
16432517
45919906
35.79
June
738.14
686.83
9523613
27759548
34.31
July
736.89
713.28
6449390
18467613
34.92

Total quantity bought back is 3,97,20,251 shares.


Price during the Buy Back (ATP)

Wednesday, August 1, 2012

Dogs of Nifty : An Investment Plan


Name
Rate
Qty
Investment
Div_Rate
Div_Amt
Yield_Rt
Hero Motocorp
2005.00
25
50125.00
45
1125.00
2.24
GAIL
353.85
141
49892.85
8.7
1226.70
2.46
Bank of Baroda
656.10
76
49863.60
17
1292.00
2.59
Coal India
359.35
139
49949.65
9.5
1320.50
2.64
ONGC
286.05
175
50058.75
7.75
1356.25
2.71
Bajaj Auto
1604.30
31
49733.30
45
1395.00
2.80
Tata Steel
414.45
121
50148.45
12
1452.00
2.90
BHEL
215.65
232
50030.80
6.3
1461.60
2.92
PNB
727.10
69
50169.90
22
1518.00
3.03
BPCL
363.30
138
50135.40
11
1518.00
3.03
500107.70
13665.05

The strategy calls for investing in the 10 highest dividend yield stocks from the NIFTY  stocks.
Dividend Yield is a value measure  where you divide the latest annual dividends by the current

stock price. So a high dividend yield usually implies stocks whose prices have fallen and are

thus out of favour with investors. Thus was coined "Dogs of the Nifty"!

The strategy requires investing an equal amount in the top 10 dividend yield stocks and rebalancing
the portfolio every year weeding out those that fail the criteria and supplementing the rest with new

stocks that qualify.

Saturday, July 28, 2012

Nifty : ATR & ADX


The true range indicator is the greatest of the following: 
-current high less the current low. 
-the absolute value of the current high less the previous close. 
-the absolute value of the current low less the previous close. 

The average true range is a moving average (generally 14-days) of the true ranges. Simply put, a stock experiencing a high level of volatility will have a higher ATR, and a low volatility stock will have a lower ATR.

Nilesh Deshpande won the "Expiry contest" in "JustNifty" & explain the basis on which he had 'figure' it as follows:

"ATR works on most days, but not on all days.

My formula is simple.

PC-ATR*.80 to PC-ATR*0.50 Buy Zone

PC+ATR*0.50 to PC+ATR*0.80 Sell Zone

where PC is previous day's close.

Bears get weak near PC-ATR*0.50 to PC-ATR*0.75, but get charged up below PC-ATR*0.80 for a target of DH-1.5*ATR

Bulls get weak near PC+ATR*0.50 to PC+ATR*0.75, but get charged up above PC+ATR*0.80 for a target of DL+1.5ATR

where DH & DL are current days High & Low respectively.

Gives out better results when used with ADX for determining whether this is a trending or a sideways market."

Friday, July 13, 2012

Vardhman Acrylics : Progress in buy-back 2


Out of a total deliverable 30,87,694 shares ( since the commencement of the buy back by Vardhman Acrylics Ltd.), the Company bought back a total of   26,10,690 shares  (about    84.55 % of the delivery volume) leaving others investors to increase their collective holdings by  8,69,778 shares.

During May/June BB got 76.04% of Delivery volume - average of 84478 daily at an average rate of 9.68 ;
and in July, with increase in BB rate to 10.92 , they got 72.09% of Delivery volume - average of 66767 daily.
Balance 23,89,310 shares are likely to be bought back at higher price range to fulfill the minimum requirement.

Thursday, July 12, 2012

Benner Cycles & BSE Sensex

Source: http://www.business-standard.com/india/news/higgs-bosoncycle-theoryeverything-i/480266/
Samuel Benner ,  a prosperous farmer wiped out financially by the 1873 panic,  noted that highs of the business tend to follow a repeating 8-9-10 yearly pattern. With respect to economic low points, he noted two series of time sequences indicating that recessions (bad times) anddepressions (panics) tend to alternate. The panic years reflect a repeating 16-18-20 pattern.


The cited article " tested the Benner cycles for DOW 30 (from 1929), Sensex 30 (From 1990), Brazil and China. The Benner clock timed all the lows and highs on the respective indices. Benner suggested a top in 2010 (happened) and a slowdown and low in 2011 (happened). Barring Reliance all the other Sensex 30 stocks are still above December 2011 lows. Benner’s cycle foresees prosperity ahead into 2019 and then depression in 2021. Markets have an innate ability to surprise. We won’t bet against Benner’s TIME symmetry."

High (marked in red Rectangle) followed 9,10 already and next is due to be after  8 years  in the Year 2018. Note the 16 years gap in Low  (marked in Blue Rectangle) . Panic low is marked in Green Rectangle


Applying "Rules of 72", Sensex is required to enhanced to 3910 (in 2000) from 1955 in 1991 & instead it showed Extra growth of 57% ; further, to 12300 in 2010 & instead showed an Extra growth of 76%.
In 2018, projection for Sensex comes to 42,216 & with "fingers crossed " look forward to EXTRA of NN% !