Total Pageviews

Monday, April 30, 2012

NIFTY & Fibonacci Arcs


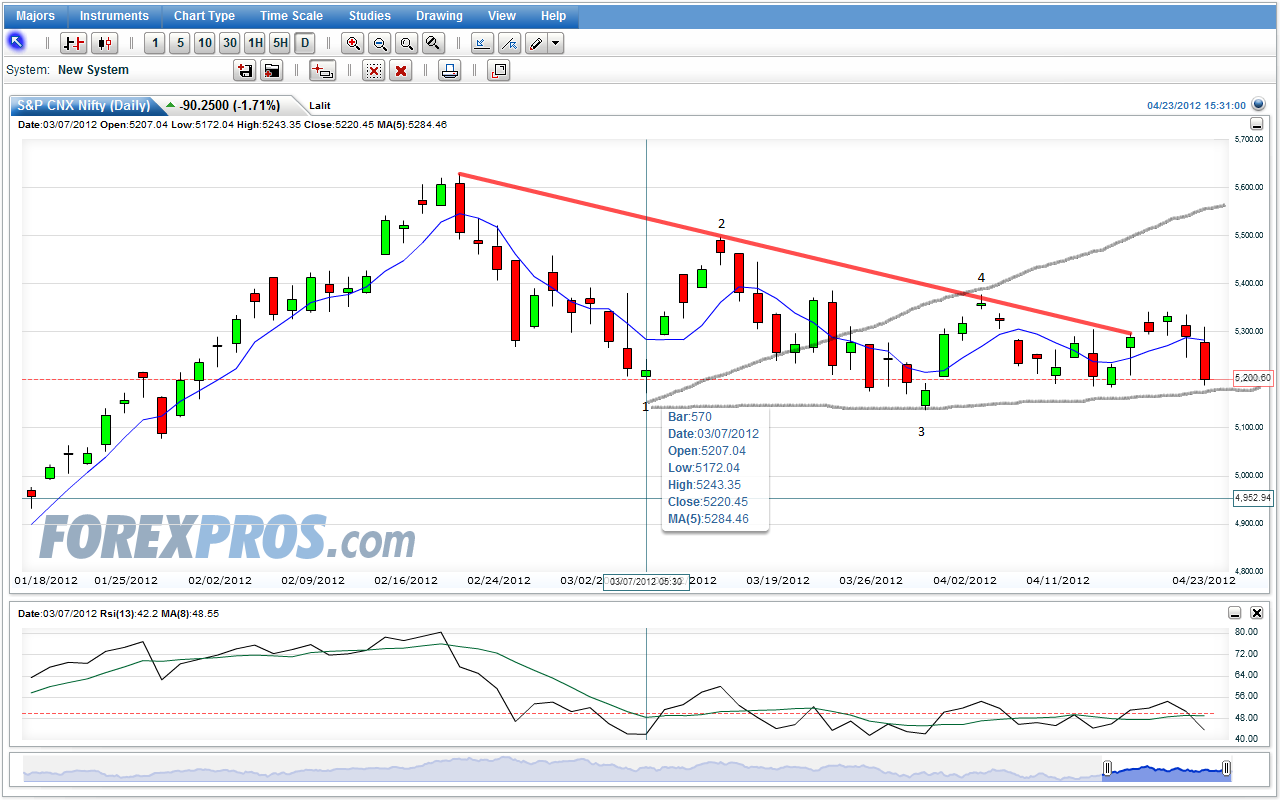
A fibonacci arcs starting at point 5629 & extended up 4531 was imposed in the Nifty charts since July 2011. Notice that point 1 of the wolfe wave is situated on arcs 38.2%. Point 3 appears to be on imaginary arcs 50%. Line projected from point 4531 has lent supports lately.Target level for the ww bull is situated at/near the high of July 2011


.
Gann Square based on Nifty =5053
Supports 5184 5148.06 5112.25 5076.56
Resistances 5220.06 5256.25 5292.56 5329

Saturday, April 28, 2012

NSE Nifty : Gann Square with 4531

To generate the GANN square, one needs a reference point. We take this to be  4531 (a recent low) for Nifty Index as on 20th December  2011 and proceed as follows:-

Step 1: Take SQRT(Input) = SQRT(4531) = 67.3127                 

Step 2: Now we get N= Integer {SQRT(Input) - 1} = 66 & square of N =4356  being placed in center of (21X21) grid.

Step 3: Next increase the N by 0.125 (45 degrees) ( 1/8th of 360 degree) & get square of it . Place this in left block adjacent to center block where u placed 4356.

Step 4: Increase the value of N further by 0.125 & square it , and keep repeating ; Place the squared up value one after another in a spiral fashion clockwise , filling up block until one level of square is completed. These process of generating square of (N plus n*.0125), where n= integers 1 to n may be continued as required.


Let us find out how these fits with the following charts. Horizontal lines commensurate with these numbers were placed for convenience.

Resistances were 5220, 5238,  5256, 5274 etc

Supports were 5202, 5194, 5166, 5148 etc


Wednesday, April 25, 2012

Nifty : Wolfe wave - An Analysis post event


Post event an analysis of a wolfe wave bull set up is being made to find out any charastratic for future guidance. Specially, it is observed that Nifty started rising from Point 5 (marked in oval) but retraced to a lower level being called 5 Final from where it rose steadily along a line to the target 6 .

I have tabulated some Data in the following table:

Date
R_No
Open
High
Low
Close
Candel
Fib_No Relation
4-Oct-11
1
4823.50
4869.75
4728.30
4772.15
B
1
28-Oct-11
25
5341.90
5399.70
5322.80
5360.70
W
21
23-Nov-11
51
4779.50
4779.50
4640.90
4706.45
B
55
7-Dec-11
65
5050.10
5099.25
5032.25
5062.60
W

20-Dec-11
78
4635.80
4637.25
4531.15
4544.20
B
2-Jan-12
91
4640.20
4645.95
4588.05
4636.75
B
89
22-Feb-12
142
5609.75
5629.95
5491.35
5505.35
B
144

I have assigned a number "1" to the date corresponding to Point 1 of wolfe wave. Point 2 was 25th day and nearest to Fibonacci number 21. Point 3 was 51st  day and nearest to Fibonacci number 55. Point 4 was 65th day without any relationship as before. Point 5 initial was 78th day and Point 5 final was 91st day and nearest to Fibonacci number 89. Is it just coincidence that Nifty rose sharply from this 5F rather than 5I ? And, finally , Nifty reached the target on 142nd day & nearest to Fibonacci number 144.

Based on average of Open, High, Low & close, Point 1 -> Point 2 is 557.85 and Point 5F -> Point 6 is 931.36 so we may say rise was 1.67 times former.  In case of contrasting triangle, Elliot wave requirement is a minimum of  1.75 incidently .


Monday, April 23, 2012

Nifty : a wolfe wave set up


1. Number 2 wave is a top.

2. Number 3 wave is the bottom of a first decline.

3. Number 1 wave is the bottom prior to wave 2 (top). Point 3 must be lower than point 1.

4. Number 4 wave is the top of wave 3. The wave 4 point should be higher than the wave 1 bottom.


Chart is conforming with the standard wolfe wave requirement.

Today's candle is poised to be the entry point for a ride to the epa line (1 to 4).  SL is 5126
(recent low - 10)


ChartNexus chart is better in drawing; first oval is point 3 & second oval is expected point 5
for a bull set up ; SL 5080


Wednesday, April 18, 2012

NIFTY : Thrusting Up or Down ?

My first observation of the rise of Nifty was " Notice in the 5 hourly NIFTY future chart the 1st triangle starting 01/02/12 & ending on 07/03/12 was of 35 days, 2nd ending on 29/03 was of 22 days & 3rd ending on almost 11/04 was of 13 days with the Yellow base line. Time-wise there is co-relation with fibonacci numbers 34, 21 & 13 ! All made lower High & but found support along the yellow (~ 5175) line (April 12 at 9:17am)". Situation stands updated in the daily chart.


However, in to-day's 1 minute chart, the Nifty , after 'Yo-Yoing' till 2 PM, seems to have conceded the battle before over-welming distributions and retreated to low of the day creating a black candle. NIFTY, having failed to thrust UP, is heading for a DOWN move to around 5000 in a few days IMHO.


Saturday, April 14, 2012

Nifty : Wealth Creaters

Company Name 13/04/12 Retracement level Twelve M Trailing  EPS Book value
Price Fibo_61.8 Yearly P/E Ratio RONW 
Wealth Creater
Tata Steel 449.80 448.892 93.99 364.35 4.79 25.80
Sesa Goa 186.20 217.142 34.46 147.40 5.40 23.38
Sterlite Ind 106.85 125.728 16.30 123.28 6.56 13.22
PNB 902.50 937.124 137.43 634.13 6.57 21.67
Cairn India 341.80 307.064 43.04 210.96 7.94 20.40
Grasim 2640.35 2343.372 296.31 1585.21 8.91 18.69
Tata Motors 289.30 199.12 31.26 59.94 9.25 52.15
BHEL 258.50 309.71 26.38 82.35 9.80 32.03
ONGC 260.80 274.088 26.03 134.80 10.02 19.31
GAIL 356.25 385.884 31.16 167.24 11.43 18.63
Reliance 751.55 823.756 64.69 451.97 11.62 14.31
Axis Bank 1162.15 1056.748 96.45 459.80 12.05 20.98
Jindal Steel 497.55 536.848 40.57 150.93 12.26 26.88
SBI 2212.30 2101.598 172.07 968.44 12.86 17.77
Bajaj Auto 1639.45 1482.706 125.52 166.13 13.06 75.56
IDFC 132.45 117.122 9.96 74.35 13.30 13.40
NTPC 166.75 167.28 11.41 83.01 14.61 13.75
Coal India 338.90 342.896 22.74 52.75 14.90 43.11
Mah and Mah 691.85 716.32 42.52 231.91 16.27 18.33
ICICI Bank 865.00 831.236 52.19 477.82 16.57 10.92
Power Grid Corp 112.00 102.022 6.42 46.52 17.45 13.80
Infosys 2402.55 2596.334 136.15 452.37 17.65 30.10
Hero Motocorp 2056.55 1832.85 113.99 148.03 18.04 77.00
ACC 1258.75 1110.528 69.33 383.08 18.16 18.10
Larsen 1282.30 1312.418 68.94 401.81 18.60 17.16
Wipro 419.30 372.502 22.23 91.46 18.86 24.31
Ambuja Cements 161.90 143.684 8.00 57.36 20.24 13.95
TCS 1068.35 1046.778 51.82 125.20 20.62 41.39
HCL Tech 478.95 424.176 23.23 110.52 20.62 21.02
Dr Reddys Labs 1735.00 1536.126 83.63 237.78 20.75 35.17
Maruti Suzuki 1322.75 1102.078 57.29 495.25 23.09 11.57
Kotak Mahindra 581.50 472.524 24.34 91.76 23.89 26.53
Cipla 314.05 306.234 13.04 82.91 24.08 15.73
HDFC Bank 529.35 453.48 20.57 108.14 25.73 19.02
Bharti Airtel 323.50 368.278 12.25 117.70 26.41 10.41
Sun Pharma 585.40 491.142 21.34 91.57 27.43 23.30
ITC 236.25 202.066 7.46 20.92 31.67 35.66
HUL 425.15 327.884 11.91 12.23 35.70 97.38
Siemens 791.05 750.386 20.02 112.11 39.51 17.86

Nifty Wealth Destroyers


In course of analyzing Nifty, its component’s SMA (Simple moving average), trailing 12 months EPS & book value, I found 11 Companies are wealth destroyer in the sense that they earn less than 10% yearly basis which is being available from putting one’s wealth with a Bank.   Surprisingly but for Reliance Comm, Hindalco & Reliance Infrastructure, all are quoting over their book value.

Bluest of blue chips & darling of FII HDFC Ltd. Is among these wealth destroyer ; P/E ratio being 25+ & Price: book value being 2+

Price
Company Name
12 TEPS
Book value
P/E Ratio
RONW
677.85
BPCL
-47.47
424.60
Negative
Negative
499.80
Ranbaxy Labs
-68.72
132.48
Negative
Negative
103.20
Tata Power
0.36
59.11
286.67
0.61
84.40
Reliance Comm
3.70
196.22
22.81
1.89
114.85
Reliance Power
2.94
60.01
39.06
4.90
197.90
DLF
7.91
154.89
25.02
5.11
77.35
Jaiprakash Asso
3.48
49.74
22.23
7.00
124.85
Hindalco
12.03
151.56
10.38
7.94
546.00
Reliance Infra
69.81
877.07
7.82
7.96
679.00
HDFC
26.66
318.72
25.47
8.36
93.55
SAIL
8.47
91.04
11.04
9.30