Total Pageviews

Thursday, May 31, 2012

Nifty : Inversion - analysis


Lower Chart (with outline of Nifty movements in Red) are 8 packets of wave spread over 02/12/2010 & 04/08/11 & INVERTED anti-clockwise by 180 degree. Resemblance from packet to packet is to be seen - most important thing to keep in mind is movements over 8 months are squezed in almost 5 months  both  fibonacci connections.

Monday, May 28, 2012

Nifty : A further study of Inversions


Further to my cited blog, I shall like to share some facts as follows:
IMAGE of the sub-waves such as enclosed within rectangles may be inverted (anti-clock wise by 180 degree) & looks SIMILAR in shape but squazed time wise.


Date
Open High Low Close
25-Mar-11 5588.65 5667.10 5560.95 5654.25
23-Jun-11 5269.10 5330.60 5252.25 5320.00
24-Jun-11 5343.40 5477.85 5343.40 5471.25
4-Aug-11 5412.40 5434.50 5323.15 5331.80
5-Aug-11 5204.35 5229.65 5116.45 5211.25
9-Sep-11 5161.30 5163.75 5046.80 5059.45
12-Sep-11 4981.70 4985.60 4911.25 4946.80
30-Sep-11 4990.15 5025.55 4924.30 4943.25

Further observations in respect of the four rectangles, marked Wave #1 , Wave #2, Wave #1(inverted) & Wave #2(inverted), are tabulated hereinbelow:-
Period ending Av_ High-Low Av_Volume Gap_Next day  Diff from Mean Av_High/Low
23-Jun-11 78.24 112883420 23.40 2855553(High)
4-Aug-11 73.91 115950028 -127.40 338 5606(High)
9-Sep-11 106.03 159948823 8.05 3064962(Low)
30-Sep-11 133.29 161267007 -77.75 2914977(Low)
Mean is am imaginary line (5268),based on closing as on 04/08/11 & opening as on 05/08/11

Most amazing observations besides RESEMBLANCES is a GAP UP or DOWN in adjoining rectangles.


Fusion of Nifty


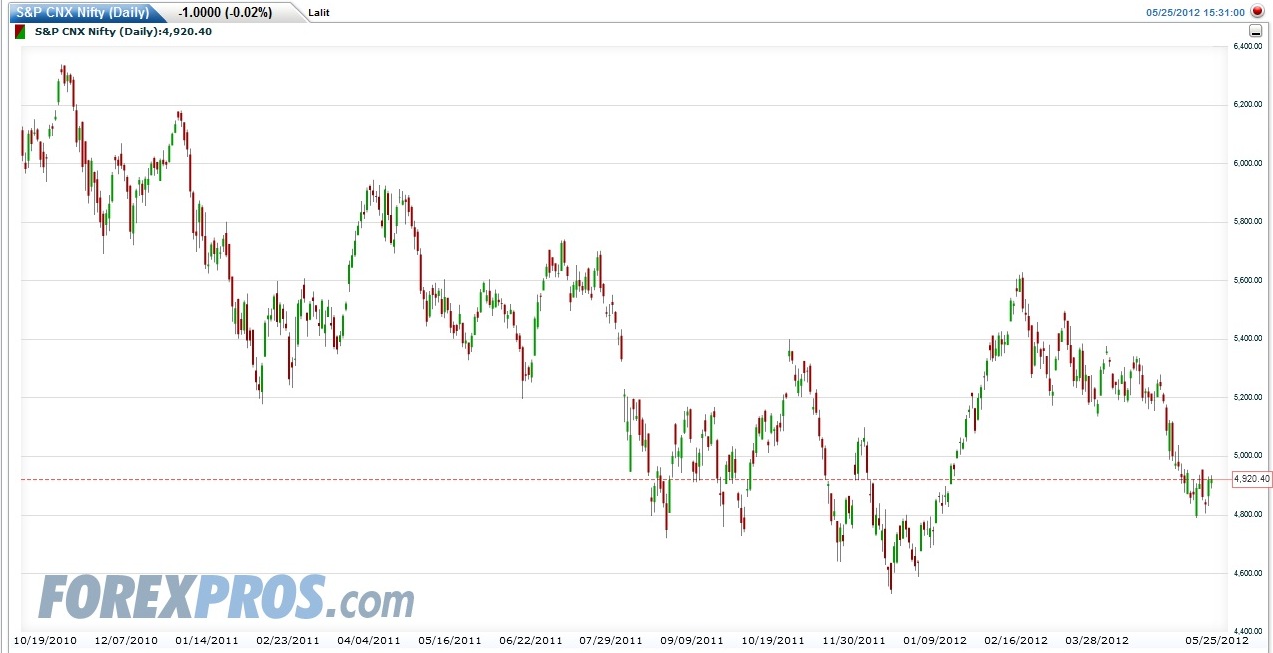
Taking a tip from Kirtanjee's "centre of gravity" (Facebook) , had a got a 'Fibonacci arcs" imposed on Nifty chart (centered on a gap down in August 2011) & captured. Another copy of same was turned (anti-clock wise) 180 degree & image above horizontal line erased & merged as above.
Fusion is the result as shown in the undernoted collage: top being 'half of chart' above HL, actual Chart in the middle, bottom being "Mirror image" (MI) of 'half chart'.
Notice A & B, as in MI squzed, in chart marked "A" & "B" with GOOD RESEMBLANCE.
 MI marked "C" yet to be charted out based on highs before 04/08/11, logically NIFTY lows done 4809, lowers 4600, 4379 & 4217 looks shattering but there r hopes in rising levels thereafter,


As it is almost ten months since 04/08/2011, rest of unfurling may take 13 (a Fibonacci number) months , i.e., by end of August 2012


Nifty : MA34 & MA 89 Crossover


Date Open High Low Close MA34/89 P MA34 Gap_Fib_D
19-Feb-10 4887.30 4887.30 4805.55 4844.90 5013.30 Down
1-Apr-10 5249.20 5298.60 5249.20 5290.50 5070.00 Up 41
9-Jun-10 4985.05 5050.60 4980.10 5000.30 5091.70 Down 69
12-Jul-10 5352.25 5402.70 5351.60 5383.00 5192.80 Up 33
31-Dec-10 6105.10 6147.30 6103.55 6134.50 5958.30 Down 172
26-Apr-11 5876.85 5893.20 5791.55 5868.40 5678.80 Up 116
8-Jun-11 5535.25 5556.60 5514.90 5526.85 5555.30 Down 43
8-Feb-12 5343.80 5396.90 5325.20 5368.15 4965.80 Up 245
10-May-12 4984.15 5039.30 4950.30 4965.70 5212.00 Down 92

Sunday, May 27, 2012

Nifty-Defty-Euro-$Dollar


Upper chart for Euro-$ has x-axis from 1.2400- 1.360, which may be stated to be 100-110 in scale,

Middle chart for  DEFTY has x-axis from 2800-4000, which may be stated to be 100-140 in scale, &

Lower chart for NIFTY has x-axis from 4400-5800, which may be stated to be 100-130 in scale.

Saturday, May 26, 2012

Nifty with Euro-$


Upper chart for NIFTY has x-axis from 4400-6400, which may be stated to be 100-145 in scale.
Lower chart for Euro-$  has x-axis from  1.2400- 1.480, which may be stated to be 100-120 in scale.

Wednesday, May 9, 2012

NSE NIFTY : Observations


Projection line from 6338.50 as on 5-Nov-10 is touching lower tops till 2011; projection line from 4531.1 as on 20-Dec-11 touches the fibonacci arcs near 6300 +

Table of Nifty Open,High, Low & Close
Date 27/10/2008 assigned Fibonacci number (marked as such) 1

 
Date_Srl
Fib_Count
Wv_Count
Date
Open
High
Low
Close
39748
1
Wv(0)
27-Oct-08
2583.75
2585.30
2252.75
2524.20
39749
2
28-Oct-08
2526.20
2695.95
2526.20
2684.60
39750
3
29-Oct-08
2685.30
2781.25
2631.90
2697.05
39752
5
31-Oct-08
2696.30
2921.35
2696.30
2885.60
39755
8
3-Nov-08
2885.40
3062.05
2885.40
3043.85
39757
10
Wv(1)
5-Nov-08
3155.75
3240.55
2971.00
2994.95
39760
13
8-Nov-08
0.00
0.00
0.00
0.00
39768
21
16-Nov-08
0.00
0.00
0.00
0.00
39781
34
29-Nov-08
0.00
0.00
0.00
0.00
39802
55
20-Dec-08
0.00
0.00
0.00
0.00
39836
89
23-Jan-09
2705.45
2765.55
2661.65
2678.55
39878
131
Wv(2)
6-Mar-09
2576.75
2628.10
2539.45
2620.15
39891
144
19-Mar-09
2797.05
2822.25
2771.35
2807.15
39975
228
Wv(3)
11-Jun-09
4657.40
4679.55
4586.15
4637.70
39980
233
16-Jun-09
4478.10
4537.95
4405.95
4517.80
40007
260
Wv(4)
13-Jul-09
4003.40
4003.40
3918.75
3974.05
40106
359
Wv(5)
20-Oct-09
5145.60
5181.95
5102.65
5114.45
40120
373
Wv(a)
3-Nov-09
4712.25
4729.85
4538.50
4563.90
40124
377
7-Nov-09
0.00
0.00
0.00
0.00
40156
409
Wv(b)
9-Dec-09
5147.65
5147.65
5090.60
5112.00
40168
421
Wv(c)
21-Dec-09
4983.65
4997.85
4943.95
4952.60
40280
533
Wv(d)
12-Apr-10
5354.15
5382.15
5324.90
5339.70
40323
576
Wv(e)
25-May-10
4945.30
4946.60
4786.45
4806.75
40357
610
28-Jun-10
5271.10
5339.45
5270.75
5333.50
40385
638
Wv(i)
26-Jul-10
5446.55
5466.25
5409.20
5418.60
40421
674
Wv(ii)
31-Aug-10
5413.55
5413.90
5348.90
5402.40
40458
711
Wv(iii)
7-Oct-10
6186.85
6199.45
6107.50
6120.30
40480
733
Wv(iv)
29-Oct-10
6021.15
6032.65
5937.10
6017.70
40487
740
Wv(v)
5-Nov-10
6321.85
6338.50
6303.10
6312.45
40522
775
Wv(a)
10-Dec-10
5761.00
5865.50
5721.15
5857.35
40547
800
Wv(b)
4-Jan-11
6172.75
6181.05
6124.40
6146.35
40585
838
Wv(c)
11-Feb-11
5219.65
5319.45
5177.70
5310.00
40639
892
Wv(x)
6-Apr-11
5908.00
5944.45
5868.80
5891.75
40688
941
Wv(a)
25-May-11
5389.10
5389.10
5328.70
5348.95
40732
985
Wv(b)
8-Jul-11
5734.65
5740.40
5651.05
5660.65
40734
987
10-Jul-11
0.00
0.00
0.00
0.00
40736
989
12-Jul-11
5556.90
5580.25
5496.95
5526.15
40820
1073
4-Oct-11
4823.50
4869.75
4728.30
4772.15
40844
1097
28-Oct-11
5341.90
5399.70
5322.80
5360.70
40870
1123

23-Nov-11
4779.50
4779.50
4640.95
4706.45
40884
1137

7-Dec-11
5050.10
5099.25
5032.25
5062.60
40897
1150
20-Dec-11
4635.80
4637.25
4531.15
4544.20
40910
1163
W2
2-Jan-12
4640.20
4645.95
4588.05
4636.75
40961
1214
W3
22-Feb-12
5609.75
5629.95
5491.35
5505.35
40975
1228
7-Mar-12
5207.05
5243.85
5171.45
5220.45
40982
1235
14-Mar-12
5490.55
5499.40
5437.80
5463.90
40997
1250
29-Mar-12
5145.95
5194.30
5135.95
5178.85
41002
1255
3-Apr-12
5353.20
5378.75
5344.45
5358.50
41032
1285
3-May-12
5211.20
5217.30
5180.65
5188.40