Total Pageviews

Wednesday, July 24, 2013

Nifty : Projecting a High during August 2013


Without repeating my earlier observations,
http://lalitlk-lalit-lk.blogspot.in/2013/05/nifty-mirror-inversion-2009-13.html

I shall explain a slight change in my hypothesis of the 'mathematical model' for Nifty Index value. Earlier, the point "5280" was used as a 'pivot' for all calculations. Influenced by 'perturbation theory' , & my observation of  the Gann square having a great role in many things RANDOM, I have set the 'pivot' as

5256.5 = mean of { Sq (73) + Sq (72) }= (5329+5184)/2.


5329 was selected influenced by close of 4-8-2011 & 5184 was selected by open of  very next day.

OHLC value of the Nifty was used to determine the value of ‘Open - 5256.5’, ‘High-5256.5’, ‘Low-5256.5’ & ‘Close-5256.5’ , e.g., 155.9, 178.0, 66.65 & 75.3 for 4-Aug-2011. Similarly for all prior days based on historical data { Sample data in 'Pink' shaded as above } ( Data Sourced from NSE).

Accordingly, mirror projections for 5 Aug 11 are calculated as :
open =5256.5 -75.3 (corresponding to CLOSE), high =5256.5 - 66.65 (corresponding to LOW), low=5256.5 -178 (corresponding to HIGH) & close=5256.5 -132.4 (corresponding to OPEN)
{Data pertaining 4 Aug 11}.
Calculations for SUBSEQUENT days were made SIMILARLY based on PRIOR days (e.g., 8 Aug 11, 9 Aug 11 etc etc  3 Aug 11, 2 Aug 11 etc etc) { Sample data in 'Blue' shaded as above }
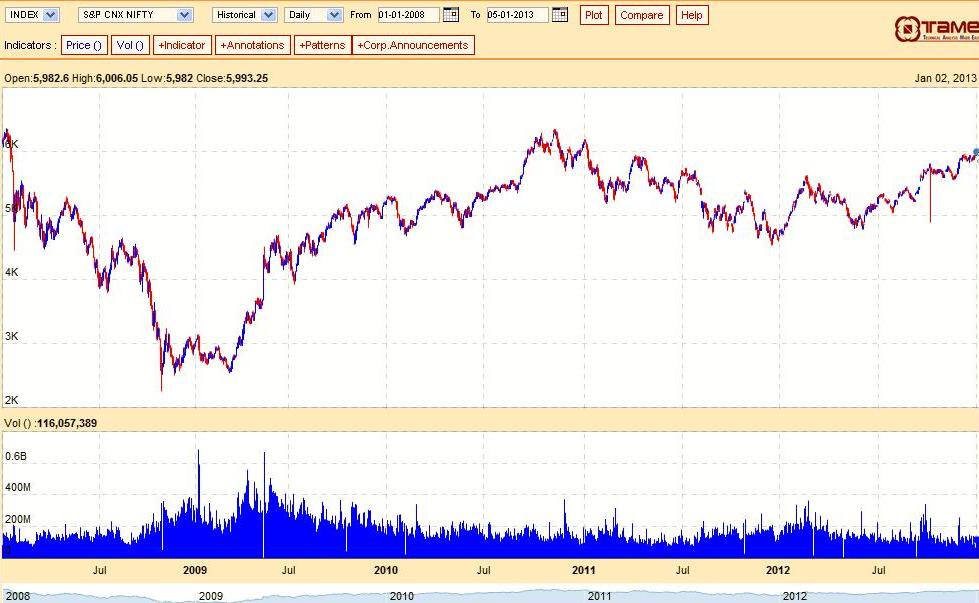
Actual Index had been AHEAD of the projected value mostly over the period of 491 days. Latest variations are as per the attached Chart :


And, the 'Projection Values'  are tabulated  for a month ending on 24th July 2013 ,in the image of Excel sheets, Remark implies 'Actual' is 1.01, etc. times the Mirror Projections  as follows:


Projected value of the Index for the month of August 2013 are as follows:


Cross your fingers & await a range of "5700-6400 " in the coming month.


Saturday, June 15, 2013

SBI & its Listed Subsidiary: A comparative Study

Nifty EOD 14/06/2013


Red line is POFT (following Wave Rider) in this Hourly chart &  green line connecting 6133-5972 (most recent POFT) ; Friday's bounce back touch this line after recovery of 39% of previous falls (273).  POFT line
     6229 - 6133 are shown in blue.

Chart in 5 Hrs


After two spinning tops ,below the POFT red line, Friday ended with  morning star and bullish abondoned baby pattern . With RBI policy due, Monday is going to have a crucial day for Nifty.

Thursday, June 13, 2013

BEBO: Understanding MACD Oscillators


Lower MACD (5,34,5) as in my Charts.

The move from 5477.xx - 6229.xx - 5683.xx double teamed by BEBO Scope and Wave O Scope......using Hourly chart.

Orange Line represent
divergence by Bebo on the move up from 5477 - 6229...........a clear negative divergence implying END of WAVE

Duration of the move - 27 full sessions.........appropriate is Hourly

The retracement......from 6229..........Is it a retracement?
If so..........we should not violate 5477 and must post a new high!

Is it possible?
We have Negative Divg on Daily chart between prior peak 5630 and most recent peak 6229...............and we have similar divg on hourly chart...........described above.

I do not thing we will visit the 6229 zone..........NOT unless we see a POSITIVE DIVERGENCE on the HOURLY Chart..................and

Currently there is no scope ..............for it to occur.............We will have to rise a bit................and then dip to post new lows.................so shortz are favorable for positional tradez........using front month options (july) 

Now to examine the move from 6229.xx which occured with NEG D on big and also bigger degree.....................

Waves for this move down in purple.............and its (c) has done 153% at current low of 5683.xx and has room to go up to 5658

Now the dilemma...........is it (a) (b) (c) = a [simple zz] or is it (a) (b) (c) = w [double zz]

Tough call................coz............if the move 6229-5683* is wave a...............the wave b that follows wud retrace a min of 38.2% and max of 99.99%.............(ZZ rule of wave b will not go beyond start of green a (6229)

Helping us here is big hearted BEBO............;)

If it were simple ZZ.............then we shudda had a POSITIVE Divg between point (c) and point (a)..........it is conspicuously absent.

BEBO confirms a lower low...........and hence 5683* is wave green w.

What follows the w in a DZZ............wave x

Commonly known to retrace between 23.6 and 38.2% of wave w..............which did 546* points.

546 x .236 from 5683* is at 5812 and the .382 is at 5892....
................

Where will the turn occur?..................I don't know......
However, when the turn occurs..............We should be able to see it.

Now to seek concurrence from Mr. POFT

Our move began 5477.xx and the first higher low after that is 5500............connect these two and extend all the way to the price axis............shown by rising green line.........note..........that

Each succesive higher low that followed did not touch this line...............so after the NEG D at 6229..............the min target was this green line...............and the maximum..........I DONT KNOW......now.............and I will NEVER EVER KNOW.............

But when the turn occurs............that is when I stand a reasonable chance of figuring it out.......

How far can the x wave go?
Based on fibo.........we already know it is between .236 and .382.........and based on POFTING?????

Draw two more POFT lines.............
6229 - 6133............shown in blue currently around 6000 and declining at the rate of approx 10 point per day.

6133-5972.....most recent POFT.........shown in grey...dclining much more rapidly than the blue............almost 23 point each day.......and currently at about 5800.

Expecting x to do one or all of the following:

Kiss the grey and reverse to post the y
If it kisses the grey and surives for 5 hourly sessions.....it will kiss the underside of the rising green............now at 5900 and rising approx 8 per day.

Turn around zone shaded in yellow.

Once prices breakout over the shorter YELLOW POFT.....................Time to close ALL short positions.........................

and once it surives for 5 sessions................over this............LONG CE 


Have a good evening and Jai Chiranjeeva
 

Sunday, May 19, 2013

Nifty : Mirror inversion (2009-13)


A hypothesis (plural hypotheses) is a proposed explanation for a phenomenon, per dictionary.


As my hypothesis is “after two GAPS Down one after another , waves are PENDULUM like reverting, so to say after inverting anti-clock wise by 180 degree.


On 5th August 2011, there was Gap down of 127.45 in NIFTY and on the next working day the 8th August, there was a Gap down of 127.40 further. '5280' is the middle point of two candles in the chart.


OHLC value of the Nifty was used to determine the value of ‘Open - 5280’, ‘High-5280’, ‘Low-5280’ & ‘Close-5280’ , eg., 132.4, 154.5, 43.15 & 51.8 for 4-Aug-2011. Similarly for all prior days based on historical data (Sourced from NSE).

Accordingly, mirror projections for 5 Aug 11 are calculated as :
open =5280-51.8 (corresponding to CLOSE), high =5280-43.15 (corresponding to LOW), low=5280-154.5 (corresponding to HIGH) & close=5280-132.4 (corresponding to OPEN)
{Data pertaining 4 Aug 11}.
Calculations for SUBSEQUENT days were made SIMILARLY based on PRIOR days (eg., 8 Aug 11, 9 Aug 11 etc etc  3 Aug 11, 2 Aug 11 etc etc)

In the above image of Excel sheet , please notice that OHLC for Nifty from 5th August 2011, and the calculated 'Mirror projection' ; ratio of Actual to Projection are given under bluish shade. Chart, below, shows the total range :
And the Data are analysed as per the following parameters
A0.991.016013.51
B0.981.025712.84
C0.971.03327.21
D0.961.04398.78
E0.951.05337.43
X< 0.95> 1.059421.17
XX< 0.90> 1.1012929.05
444100
  
It is observed that out of 444 cases, mis-matches (X & XX) are more than good matches (A with a variation of 1% or less), B (<2%), C (<3%), D (<4%) and E (<5%), however, the mystery of PAST influencing the PRESENT can not be brushed aside.


Note that on 12 March 2013 (latest worst mis-match), the Actual Nifty was 1.12 times the Projection for the said day, and on 26 March 2013 (latest best match), the Actual Nifty was 1.007 times the Projection for the said day. Projection for next week are also listed. 


Here is a super-imposed inverted chart on the Nifty chart since 04/08/2011.


Wednesday, February 20, 2013

Best Performing Stocks: "Market knows"

A Morgan Stanley report released in February 2013 concludes that "the collective wisdom of the market is superior to that of analysts". Capital Market (Feb 18-Mar 03, 2013) made a study of their DATA BASE  & reported that 53 Companies out-performed the BSE Index over 5 years.

It was assumed that an investor followed the SIP system  & bought 1 share at the closing price of month over FIVE YEARS & similarly 1 unit of SENSEX. On the basis of the return so generated compared  with the FIVE years growth of 0.62 (for SENSEX), the study reveals 53 Companies listed on Page 10 .

I had pruned the list, by eliminating Companies with market Capitalisation of Rs. 1,000 crores or less, to just 39 Companies.

Investors may consider these Companies, scrutinise the strong & weak points before investing.Full data are in:

https://excel.office.live.com/x/ExcelView.aspx?FBsrc=https%3A%2F%2Fwww.facebook.com%2Fdownload%2Ffile_preview.php%3Fid%3D271187749681168%26time%3D1361430442%26metadata&access_token=1835286898%3AAVKd9GrW_0qtqkmUFtht2mlaMOf-wW5vAWF9HMlG_Dal3A&title=DS_BestMKT2.xlsx

Gillette and BOC  have public holdings less than 25% and are required to comply with the SEBI guidance by either DELISTING or fresh issue to the public.

Caution: there is No guarantee that they may out perform the Index in future just because they had done previously.


Monday, January 7, 2013

Nifty : Performance since High of 2008 (Part 3)


Over the last five years, 31 constituents of the Nifty out performed the Index.
Lupin was Super performer - look at red line - & its consistent moves .


Next is Asian Paints


Next is Sun Pharma


Next is Hero Motors


And finally Dr Reddy had given 5 STARS performance over 5 years


Nifty : Performance since High of 2008 (Part 2)


Post all time high in BSE Sensex & NSE Nifty in January 2008,

Neowave analyst Milind Karandikar suggested the Sensex target at around 27,000 mark”  for the Year 2008,
stock market consultant and analyst Devangshu Datta  talked of the possibility of moving till 7,000 in the longer-term of six-eight months and
Orpheus Capitals CEO Mukul Pal predicted  “After Sensex 20,000, the market expectations are for 30,000, but I don't see the Sensex extending beyond 24,000 this year “

Even others were airing similar views such as HSBC securities


All these uproar for the market in 2008 proved wrong and the NSE Nifty  corrected  by over 64% to 2252.75 as on 27/10/2008 shedding 4104 points. Subsequently, it recovered over 99% of loss to regain a  high of 6316+ , e.g., 6338.5 as on 05/11/2010.  Incidentally, after scaling 6K figure first on 11-12-2007, Nifty had a closing in 6K’s in just 66 occasions.


8-Jan-08
6282.45
6357.10
6221.60
6287.85
27-Oct-08
2583.75
2585.30
2252.75
2524.20
5-Nov-10
6321.85
6338.50
6303.10
6312.45

On the eve of 5th Anniversary of the Nifty High, I have to state that the high of 6357.1 is a dream to look forward to. Constituent scrip performed far better over the past five years, however,  anyone who had invested in ETF Nifty is a loser,  as per the attached analysis: -

Please copy & paste to your browser
https://excel.office.live.com/x/ExcelView.aspx?FBsrc=https%3A%2F%2Fwww.facebook.com%2Fdownload%2Ffile_preview.php%3Fid%3D131388520355863%26metadata&access_token=1835286898%3AAVKh5Swq7F1xRL1FafPGBQ9Cgu_UzV5G0DsQTcopHeqk2g&title=Nifty_Performance.xlsx


Nifty Index & some of its Constituents had under performed :


Sunday, January 6, 2013

Nifty : Performance since High of 2008


Even though the NSE Nifty is far below the historical high of 2008 (6357), there is talk of Nifty surpassing the earlier high. 

Performances of individual scrips , in the Index, were mixed as shown the followings Charts. (Source: moneycontrol)


I shall be reviewing the over all performance of the Index as on 08/01/2008 & its constituents over the past five years.