Total Pageviews

Wednesday, November 23, 2016

Nifty : Macd observations in diverse Time Frame (As on 22/11/2016)


My simple understanding is that the short term EMA_5 becomes greater than the long term EMA_34 resulting in a positive value for MACD heralding bullish time.
 
vide : http://lalitlk-lalit-lk.blogspot.in/2016/06/nifty-macd-observations-in-diverse-time.html 


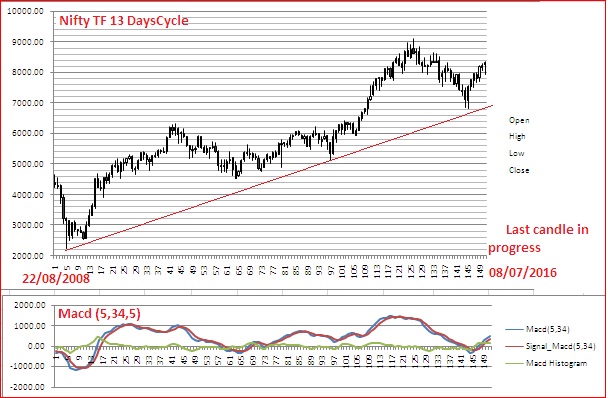
In above 13 DaysCycle chart, it is seen that Nifty is overall in bullish phase with Macd being with an positive value more than that with negative value ; specifically Macd was with negative value in just 10,5,1 candles & since dip of 4531, Macd remained in positive territory in 85 (out of 100 candles) showing long term Bullish phase.
 IMO Nifty, after a prolonged bullish time, may be going  for corrections in near term ; watching TL in green & red for intermediate support.


In 5 DaysCycle chart , Nifty showed robustness of on going bullishness.


In broad view of the 5 DaysCycle Nifty may have find support along TL's

Saturday, September 24, 2016

Analysis of Nifty with Step Sum

Introduction :

Step Sum is in the form of a new technical tool to evaluate the psychology of the market. It has been developed by Mark Lundeen and it offers a unique insight into the psychology of the market. The step sum is simply a running total of up vs. down  days and it reflects trader psychology.


“15 Count” is  running sum of the daily step used in constructing their step sum over consecutive 15 days.


Now I am trying to measure the "Quality aspect" of Step sum with a simple logic & mathematics ; simply stated here is a plan to quantify the sum of all 'Count of 15' over a period of calendar year. First refer to the Table :


Table is based on OHLC data sourced from NSE site. Step sum were calculated on daily basis, thereafter 'Count of 15' were generated by excel (by adding step up or step down days over 15 days). September 2016 data is as on Thursday 22nd Sept 2016.
Note there had been 5 cases of 'no change' in closing Nifty , resulting in 0 change in Step Sum; consequently 'Count of 15' were rendered even numbers ; such cases were added to nearest odd number (E.g., 2 were counted with 1, 4 with 3, etc)

Z (Sigma) = Net weighted Count_15 for the Year =
 Summation over the year of  [ (Number of count) X (Value of Cnt) ]  for full range of  available Cnt  { from 15 to minus 15 }
For convenience a Template for Calculation was made in excel :


Data for September 2016 were used  (as for example in above)  as in-put taking net number for Cnt 13, .... , Cnt 1 & resulting sum was divided by 15 .
Explanation : Cnt 13 means 14 Up & 1 Down, hence, its numeric value is 14/15 ; Cnt 1 means 8 Up & 7 Down,hence, its numeric value is 8/15 etc etc.

Let us share a chart of Nifty closing with Step Sum :


Incremental Step Sum is a function of  Net_Wt_C-15.


I had used the Cnt_Calculator for classic 2004-08 rise in Nifty . Here is the result :


Thursday, September 15, 2016

Nifty : Time Frame 34 Days Cycle as on 14/09/2016.


Nifty index over  20 years period is best covered in a Chart of symmetric 34 days with proper MACD  (5,34,5) aka Elliot Wave Oscillator ; in this instant it is from 23/08/1996 to 14/09/2016. Chart speaks for itself :

Nifty TF 34 DaysCycle with Macd

With out trying to label waves, I had tried to identify "swing" points in the following table :


Let me recall a few observations ; point # 1 may be considered as "0" of  starting Wavewith lowest STEP SUM comprising  of 119 UP days with 154 DOWN days resulting in minus 35..
Next few days with more UP days than DOWN days resulted in recovery of SS to minus 2  with a "swing" up;
followed by more DOWN days than UP days as a result a "swing" down with SS value of minus 30.
These process continued  from one "swing" to next "swing" ; however, since December 2011
 MACD remained positive continously with values changing only.

Another point may be mentioned is that Macd (in time frame of Bi-Monthly ) had been positive since August 2009  in last 44 candles ; but for a breach over 2 periods Macd (in time frame of  34 Days Cycle) had been positive 18 periods, breach & then 33 periods . So we may say on long term basis Nifty still in grip of BULLS.


Friday, September 2, 2016

Step Sum Analysis : Nifty Update as on 31/08/2016

Concept of "STEP SUM" & "Count of 15" were discussed in my earlier blog  & not repeated :

http://lalitlk-lalit-lk.blogspot.in/2016/02/step-sum-analysis-of-nifty-as-on.html

I shall like to share a few observations afresh post reviews of all Data at my disposal.


Above covers Nifty over 14 years with Closing & relevant Step sum at monthly rest. Note the median value of Step sum (over the period) is 232.


Next is "Count of 15" ( i.e., consecutive 15 days's step sum duly added ) ; notice a large number of data are in the range of  "+9 to -9  " & their contributions to overall step sum literally small & insignificant.


Here I had explained the concept of "Count of 15" .
The following Table elaborates the details over 4 years from 01/01/2013 & over all period  :


Let us focus our attention over four years since 01/01/2013 :


Nifty Chart of 2013-6 with key observations.


Sunday, July 3, 2016

Nifty as on June 2016 : Observations in diverse time frame

An up date to my earlier blog

http://lalitlk-lalit-lk.blogspot.in/2016/05/nifty-bi-monthly-chart-review-of-elliot.html

first let us examine Nifty TF Bi-Monthly chart :


It looks to me  waves 12345 having done Nifty is in corrective phase.

Next I had attempted to compare progress in Macd in diverse time frame :


Worried a black swan effect may be on card similar to http://www.elliottwave.com/Currencies/British-Pound-Gets-Pounded-Why-Brexits-NOT-to-Blame?rcn=tw1601


Saturday, June 18, 2016

SBBJ (Bikaner) : A TA query

Am bullish in State Bank of Bikaner & Jaipur on fundamental considerations vide

http://lalitlk-lalit-lk.blogspot.in/2016/05/merger-sbi-subsidiaries-likely-ratio.html 

last week blast was halted below all time highs of  752, 788 & 875 


Last week's rise is best studied in time frame of 10 minutes, as it cover the whole move :


However, as it effectively cover 4 days in 150 candles, it may have a short implication.

Considering a partial booking of long term position for re-entry around  594 ; is it good plan ?

Tuesday, June 14, 2016

Nifty : Macd observations in diverse Time Frame

My simple understanding is that the short term EMA_5 becomes greater than the long term EMA_34 resulting in a positive value for MACD heralding bullish time.


Nifty TF 34 DaysCycle with Macd, with declining value hinting of a cross down of the zero line sooner or later. As such my long term view is bearish.


In marked contrast, Nifty TF 8 DaysCycle, after a drop down of ZL, has crossed over ZL, showing an intermediate bullish phase.  


Above is a merged views of  the Macd's , derived from five diverse time frame, but shown in a single chart over a period of 13/12/2010 to 06/06/2016. In order to have a better perspective of the situations, I had used different filter to my Data Excel, results are following charts : 


Macd of TF 5 DaysCycle (on left hand side)  & of all TF's (on RHS)


Macd of TF 8 DaysCycle (on left hand side)  & of all TF's (on RHS)


Macd of TF 13 DaysCycle (on left hand side)  & of all TF's (on RHS)


Macd of TF 21 DaysCycle (on left hand side)  & of all TF's (on RHS)


Macd of TF 34 DaysCycle (on left hand side)  & of all TF's (on RHS)

Saturday, June 11, 2016

Nifty NeoWave :Time Frame 5 Days Cycle Charts


Carrying on lessons learnt from

http://lalitlk-lalit-lk.blogspot.in/2016/06/nifty-neowave-time-frame-75-minute.html

I have used the procedure to obtain a Time Frame 5 Days Cycle . But, why 5 DC ? Well it is my observations that TF 75 Minute is better than a Hourly & 5 Days Cycle is better than a weekly ; arising out of holidays a typical week varies duration-wise but a 5 Days Cycle is based on OHLC data from NSE site & of uniform duration.


A NeoWave chart


Detailed chart (with suggested within 55 candles) one after another. 


Analysis of these charts would attempted . In the meanwhile, looking forward to constructive critisism .


Monday, June 6, 2016

Nifty-bi-monthly-chart : An intermediate report (2) for PE June 2016

Further to earlier blog

http://lalitlk-lalit-lk.blogspot.in/2016/05/nifty-bi-monthly-chart-intermediate.html

I would like to up date as on 06/06/2016 :

First, a up dated Bi-Monthly chart (in log scale) :


My simple counts, in spite of complexity over 18 years, are

I = 1818 - 800 = 1018,
II= 1818 - 850 = 968 (95% Retracement of I ),
III = 6357 - 850 = 5507 (540% of I),
IV = 6357 - 2253 = 4104 (74.5% retracement of III),
V = 9119 - 2253 = 6866 (124.7% of III ),
A = 9119 - 6826 = 2293 (33.4% of IV) ; B in progress.

I may mention here that a "Bi-month" is of average 42 days  & being consisting calendar months of various duration.

Next is a 34 Days Cycle Nifty chart (by design of uniform duration) :


I had mention period of Macd being in positive (e.g. 1, 7 etc) and in negative {e.g., (5), (7) etc}territories. I am anticipating a dip & cross down of zero line before hitting a fresh high.
Next is log scale 34 Days Cycle Chart :


IMHO show up of Higher Macd may be on account of uniform duration in contrast higher & non-uniform duration period in case of Bi-Monthly. Let us await price actions & corresponding Macd actions . Cross down of zero line should occur first in 34 DaysCycle.


Cross down of zero line had occured   in  both 21 DaysCycle & 13 DaysCycle.


Wednesday, June 1, 2016

Nifty NeoWave :Time Frame 75 Minute Charts for May 2016

Based on Neely's NeoWave Theory { of http://www.neowave.com }, I learnt how to create a Mono wave chart with the following:


I used my excel of Nifty Time Frame 15 Minute to create a Neo Wave data base for further studies. Here are four charts for week ending on Friday (with previous Friday for the sake of continuation ) with 60 candles (in excess of  limit of 55).