Total Pageviews

Monday, February 29, 2016

Step Sum Analysis of Nifty (As on 29/02/2016)


Had introduced the 'step sum' in my earlier blog :

http://lalitlk-lalit-lk.blogspot.in/2015/12/nifty-1995-2015-step-sum-analysis.html


 “15 Count” is  running sum of the daily step used in constructing their step sum over consecutive 15 days. Gold’s 15 count reached a few 10s and 11s over the past five decades but never higher. Then last November during the selling panic in the gold market it declined to a 13 for the first time ever.
Silver’s November bottom was even harder; its 15 count declined to -15. In other words the price of silver fell below its previous closing price every day for three trading weeks. That had never happened before, although just a few months before silver’s January 1980 market top we saw its 15 count reach +15 in September 1979, according to  Mark Lundeen.

Count +/-  13”  means 14 up (down) & 1 Down(up),
“Count +/-  11”  means 13 up (down) & 2 Down(up),
“Count +/-  9”  means 12 up (down) & 3 Down(up),
And so on
“Count +/-  1”  means 8 up (down) & 7 Down(up). I had examined the history of Nifty Index since 3rd November 1995 (the day from which OHLC is being compiled by NSE). My findings are shared as below :-

Out of 244 months (during 20 years 4 months), Nifty Step Sum Count_15 most were in the range of + 9 to - 9 as per Chart :


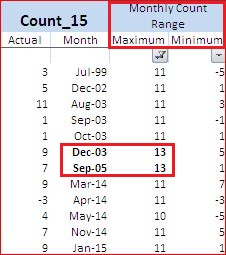
However, there were just 2 occasions of "13" count as StepUp


& just 5 occasions of "11" counts as StepDown 


& finally Step Sum Chart for Nifty (Monthly) over 20 years 4 months :


Nifty-bi-monthly-chart : Update as on 29/02/2016


Further to my observations as per my blog

http://lalitlk-lalit-lk.blogspot.in/2015/10/nifty-bi-monthly-chart-1996-2015-update.html

here is the latest Chart from October 1997 :


I am sharing crucial Macd (5,34,5) data  for certain days ; IMHO in these higher degree Elliot Wave , Nifty had done its peak  at 9119.20 thereby gaining 8344 from 775 in December 1996, time-wise taking 19 years 4 months ; Fibonacci 38.2% retrace level is 5932.
 Let us wait patiently for price actions to unfold in the present bears market. 


Friday, February 12, 2016

Nifty : Case for Holdings Long (17 years or more)


Theorem : An investor , holdings on to one's investment for 17 years or more, is on GAINS in spite of turmoils during the holding periods. (Source:   Prof. Jeremy Siegel ,  www.jeremysiegel.com )


Here is my analysis of percentage gains over 884 weeks in the NIFTY Chart -  Pre-March 1999 investors are enjoying their gains in the range of  436 to 908 % .


Based on the existing rewards


, I am looking forward to fresh high during September 2018 through April 2020 based on lows prevailing in the rectangle marked in the chart.

Present bear phase may be utilized to reap handsome rewards in 2 years 7 months. Let us see if the theorem proves itself


Wednesday, February 3, 2016

CNX-Nifty-index-time-frame-cycles-of-21 : Up date # 3


With out stating details of my data constructions, already shared in an early blog :

http://lalitlk-lalit-lk.blogspot.in/2015/10/cnx-nify-index-time-frame-cycles-of-21.html

here is my submission for NIFTY been topped out at 9119 vide chart as on 3rd February 2016 :


IMHO , Nifty at 6357 was in wave-3, 2253 in wave-4 & 9119 in wave-5.


"When the MACD is peaking above the zero-line after a strong move higher that indicates wave 3 is forming. If it is pulling-back after peaking, then it is probably forming wave 4. It is a requirement of wave 4 that it should lead the MACD to move all the way back down to below the zero-line. When 4 finishes the MACD starts rising again as wave 5 begins moving higher in the direction of the main trend. Wave 5 is indicated by the MACD crossing back above the zero-line again and forming a lower MACD high, thus signalling divergence with price which is expected to reach the wave 3 highs as a minimum expectation."
Quoting from https://blog.forex4you.com/how-i-use-macd-to-trade-elliot-waves/
I may recall here that Macd remained in negative territory at the start, was in range of 11 & 13 periods subsequently ; yesterday it dipped the zero line after a gap of  38 periods in confirmation of the Nifty being topped out at 9119