Total Pageviews

Sunday, April 24, 2016

Nifty Time Frame 75 Minute : Charts of March 2016

Here is a compilation of Charts published elsewhere :


Nifty Time Frame 75 Minute : Charts of February 2016

Here are a compilation of Charts :


Nifty Time Frame 75 Minute : Charts of January 2016

Quoting from an old blog
http://lalitlk-lalit-lk.blogspot.in/2014/12/nifty-index-time-frame-75-minutes.html

 Market in India is from 9:15 AM to 15:30 hours (3:30 PM) and of 375 Minutes duration. As such, a TF of 3 minutes cover a day with 125 candles, TF of 5 minutes covers 2 days, TF of 15 minutes cover 6 days & TF of 75 minutes cover in 30 days - all with 150 candles.

Traditionally, Daily chart  of around 30 weeks is of /around 150 candles. Fractal of daily chart is taken/accepted of being hourly, However, in my opinion , the hourly chart is asymmetrical in nature ; 1st candle depicted as 9:00 is based on 3 candles of TF  15, & 7th candle depicted as 15:00 is based on 3 candles of TF  15. Balance 5 candles (10:00 to 14:00 inclusive) are based on 4 candles of TF 15.  Best option for fractal is no doubt a TF of 75 minutes".


Thursday, April 7, 2016

Nifty : Monthly vs TF 21 DaysCycle

Traditional monthly Chart has an inherent shortcomings, viz., it has diverse time-wise duration ; it may be 20 days affair (in case of February) or as high as 23 days affair ( in case of 31 days Month). However, in a Time Frame of 21 Days Cycle it is fixed & uniform  time-wise duration


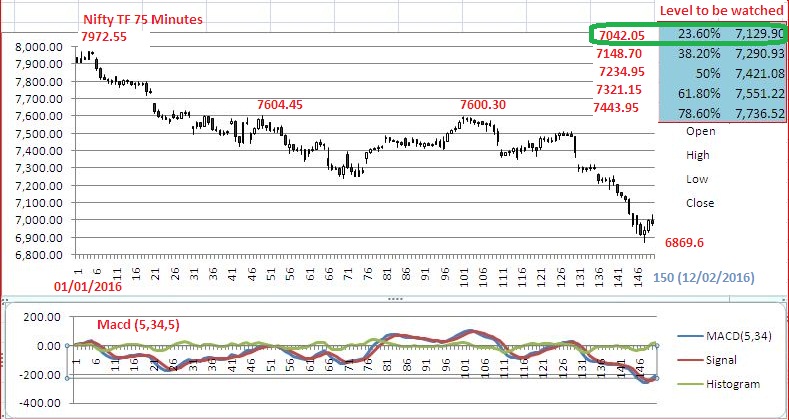
Notice Macd in the Monthly (above)  is still in positive territory over the last 3 months in 2016. However, it had drifted over the last 3 candles in negative territory in TF 21 DaysCycle (below).