Total Pageviews

Saturday, June 18, 2016

SBBJ (Bikaner) : A TA query

Am bullish in State Bank of Bikaner & Jaipur on fundamental considerations vide

http://lalitlk-lalit-lk.blogspot.in/2016/05/merger-sbi-subsidiaries-likely-ratio.html 

last week blast was halted below all time highs of  752, 788 & 875 


Last week's rise is best studied in time frame of 10 minutes, as it cover the whole move :


However, as it effectively cover 4 days in 150 candles, it may have a short implication.

Considering a partial booking of long term position for re-entry around  594 ; is it good plan ?

Tuesday, June 14, 2016

Nifty : Macd observations in diverse Time Frame

My simple understanding is that the short term EMA_5 becomes greater than the long term EMA_34 resulting in a positive value for MACD heralding bullish time.


Nifty TF 34 DaysCycle with Macd, with declining value hinting of a cross down of the zero line sooner or later. As such my long term view is bearish.


In marked contrast, Nifty TF 8 DaysCycle, after a drop down of ZL, has crossed over ZL, showing an intermediate bullish phase.  


Above is a merged views of  the Macd's , derived from five diverse time frame, but shown in a single chart over a period of 13/12/2010 to 06/06/2016. In order to have a better perspective of the situations, I had used different filter to my Data Excel, results are following charts : 


Macd of TF 5 DaysCycle (on left hand side)  & of all TF's (on RHS)


Macd of TF 8 DaysCycle (on left hand side)  & of all TF's (on RHS)


Macd of TF 13 DaysCycle (on left hand side)  & of all TF's (on RHS)


Macd of TF 21 DaysCycle (on left hand side)  & of all TF's (on RHS)


Macd of TF 34 DaysCycle (on left hand side)  & of all TF's (on RHS)

Saturday, June 11, 2016

Nifty NeoWave :Time Frame 5 Days Cycle Charts


Carrying on lessons learnt from

http://lalitlk-lalit-lk.blogspot.in/2016/06/nifty-neowave-time-frame-75-minute.html

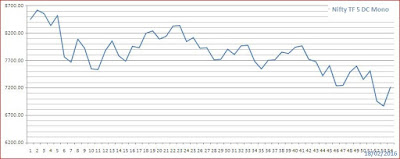
I have used the procedure to obtain a Time Frame 5 Days Cycle . But, why 5 DC ? Well it is my observations that TF 75 Minute is better than a Hourly & 5 Days Cycle is better than a weekly ; arising out of holidays a typical week varies duration-wise but a 5 Days Cycle is based on OHLC data from NSE site & of uniform duration.


A NeoWave chart


Detailed chart (with suggested within 55 candles) one after another. 


Analysis of these charts would attempted . In the meanwhile, looking forward to constructive critisism .


Monday, June 6, 2016

Nifty-bi-monthly-chart : An intermediate report (2) for PE June 2016

Further to earlier blog

http://lalitlk-lalit-lk.blogspot.in/2016/05/nifty-bi-monthly-chart-intermediate.html

I would like to up date as on 06/06/2016 :

First, a up dated Bi-Monthly chart (in log scale) :


My simple counts, in spite of complexity over 18 years, are

I = 1818 - 800 = 1018,
II= 1818 - 850 = 968 (95% Retracement of I ),
III = 6357 - 850 = 5507 (540% of I),
IV = 6357 - 2253 = 4104 (74.5% retracement of III),
V = 9119 - 2253 = 6866 (124.7% of III ),
A = 9119 - 6826 = 2293 (33.4% of IV) ; B in progress.

I may mention here that a "Bi-month" is of average 42 days  & being consisting calendar months of various duration.

Next is a 34 Days Cycle Nifty chart (by design of uniform duration) :


I had mention period of Macd being in positive (e.g. 1, 7 etc) and in negative {e.g., (5), (7) etc}territories. I am anticipating a dip & cross down of zero line before hitting a fresh high.
Next is log scale 34 Days Cycle Chart :


IMHO show up of Higher Macd may be on account of uniform duration in contrast higher & non-uniform duration period in case of Bi-Monthly. Let us await price actions & corresponding Macd actions . Cross down of zero line should occur first in 34 DaysCycle.


Cross down of zero line had occured   in  both 21 DaysCycle & 13 DaysCycle.


Wednesday, June 1, 2016

Nifty NeoWave :Time Frame 75 Minute Charts for May 2016

Based on Neely's NeoWave Theory { of http://www.neowave.com }, I learnt how to create a Mono wave chart with the following:


I used my excel of Nifty Time Frame 15 Minute to create a Neo Wave data base for further studies. Here are four charts for week ending on Friday (with previous Friday for the sake of continuation ) with 60 candles (in excess of  limit of 55).