Total Pageviews

Sunday, April 24, 2016

Nifty Time Frame 75 Minute : Charts of March 2016

Here is a compilation of Charts published elsewhere :


Nifty Time Frame 75 Minute : Charts of February 2016

Here are a compilation of Charts :


Nifty Time Frame 75 Minute : Charts of January 2016

Quoting from an old blog
http://lalitlk-lalit-lk.blogspot.in/2014/12/nifty-index-time-frame-75-minutes.html

 Market in India is from 9:15 AM to 15:30 hours (3:30 PM) and of 375 Minutes duration. As such, a TF of 3 minutes cover a day with 125 candles, TF of 5 minutes covers 2 days, TF of 15 minutes cover 6 days & TF of 75 minutes cover in 30 days - all with 150 candles.

Traditionally, Daily chart  of around 30 weeks is of /around 150 candles. Fractal of daily chart is taken/accepted of being hourly, However, in my opinion , the hourly chart is asymmetrical in nature ; 1st candle depicted as 9:00 is based on 3 candles of TF  15, & 7th candle depicted as 15:00 is based on 3 candles of TF  15. Balance 5 candles (10:00 to 14:00 inclusive) are based on 4 candles of TF 15.  Best option for fractal is no doubt a TF of 75 minutes".


Thursday, April 7, 2016

Nifty : Monthly vs TF 21 DaysCycle

Traditional monthly Chart has an inherent shortcomings, viz., it has diverse time-wise duration ; it may be 20 days affair (in case of February) or as high as 23 days affair ( in case of 31 days Month). However, in a Time Frame of 21 Days Cycle it is fixed & uniform  time-wise duration


Notice Macd in the Monthly (above)  is still in positive territory over the last 3 months in 2016. However, it had drifted over the last 3 candles in negative territory in TF 21 DaysCycle (below). 


Saturday, March 12, 2016

Nifty : Step Sum Analysis (2004-16)


Further to introduction in my blog

http://lalitlk-lalit-lk.blogspot.in/2015/12/nifty-1995-2015-step-sum-analysis.html

Step Sum is in the form of a new technical tool to evaluate the psychology of the market. It has been developed by Mark Lundeen and it offers a unique insight into the psychology of the market.The step sum is a single item Advance – Decline Line. In other words; if Nifty is down from the previous day’s close, we give it a value of (-1), if they end the day up from the previous day’s close, we give it a value of (+1). So a step sum plot is merely the net sum of up and down market days over time.

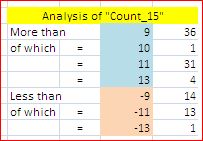
15 day running sum of the daily steps used in constructing their step sums may be called “Count 15”   A “Count +/-  15”  means All 15 either Up or Down days in continuation


We are yet to see  “count 15” in Nifty , examined over 5076 days. Even counts exceeding “9” are just a few as displayed below :

, just 50 in total – literally just 1% of the total.

For a meaning full understanding of vast Data, a suitable filter was used. A number of positive “Count 15” – specially one after another - score up the step sum & a number of negative “Count 15” – specially one after another – drag down the step sum. A close examination of Chart is suggested for better understanding.


Three  Table incorporating Step Sum Count_15 exceeding 9 is being given :


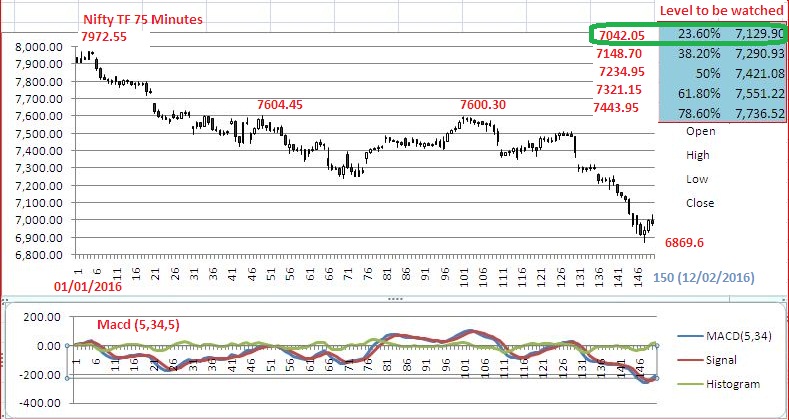
Next Chart covering Nifty 2001-16 shows Step Sum with Nifty closing ; upper portion tries to depict the influence of "Count_15" (with out filter) in the built up of step sum aspect.


Next one covers 2004-16 with Step Sum (Daily basis) & MSS (Monthly Step Sum)