Total Pageviews

Thursday, December 31, 2015

Nifty (1995-2015) : Step Sum Analysis

Step Sum is in the form of a new technical tool to evaluate the psychology of the market. It has been developed by Mark Lundeen and it offers a unique insight into the psychology of the market. The step sum is simply a running total of up vs. down  days and it reflects trader psychology.
The step sum is a single item Advance – Decline Line. In other words; if Nifty is down from the previous day’s close, we give it a value of (-1), if they end the day up from the previous day’s close, we give it a value of (+1). So a step sum plot is merely the net sum of up and down market days over time.  
I had ,in addition , observed continuous up or down as if a single up or down. It is the amazing thing about the daily ups and downs of the market is that over time 242 months , through bull markets and bear, Nifty index in the markets, see about as many up days as down. Most outstanding observation is that the sum of Step_Up over this long period is identical with that of Step_Down over the same period, , monthly positions are tabulated :  Number of months (With 0) : 117, balance arising out of Number of months (With 1) : 63, Number of months (With -1) : 61 and Number of months (With -2) : 1 is Zero only.
A Chart of  Step_Up or Step_Down , in the range of 2 to 8 monthly ,is shared here :

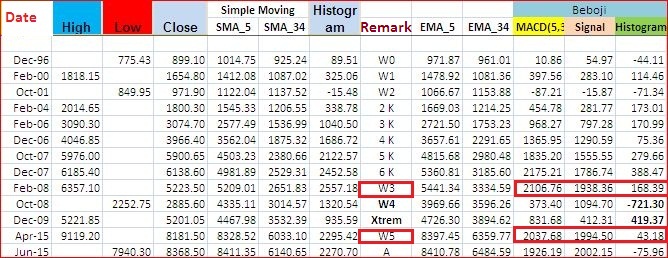
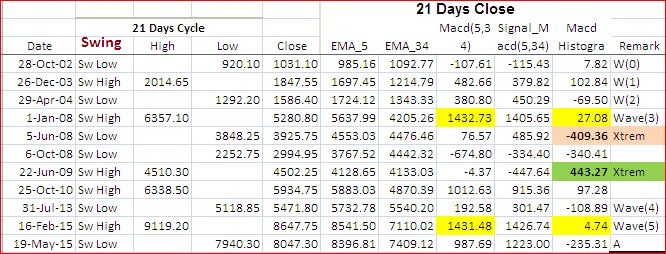
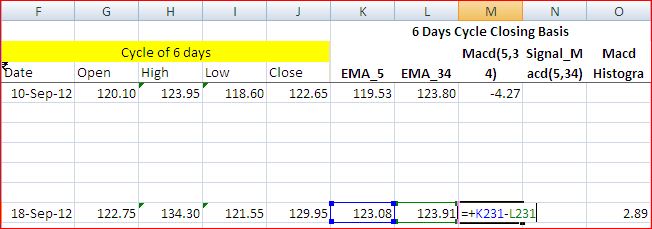
I had applied this basic concept to Nifty Data from 3rd November 1995 (for which OHLC) available from NSE site. I have used basic as per details in attached screen-shot of the excel.

Based on Data till end of 2015, first full Step Sum NIFTY chart is being shared                                 here in below :


Basic observations arising out of 5027 days are being shared in below :


It looks to me  the Step_Up's , with average value of 33.18541 ,  and  the Step_Down's ,                 with average value of 34.40273 are behaving as a irregular pendulum ; a graphical          representation follows : 


Tuesday, November 24, 2015

Silver $ Chart : Time Frame Fortnightly Update # 2

IMHO, Silver looks at the fag end of (B) with low of 13.915 on November 23, 2015 {79.25% of (A) done} & likely to get support from TL from 5.52-8.41 rising projection around 13.6  ; let us watch for termination .

Here is a closer views in a 150 candles from same Data : a wedge & triple bottom is being observed


In the next chart, we are viewing moves more closely in 12 hourly chart; notice wedge break down from 17.77 to 13.97 was retraced to the extent of 62.7%  at 16.356 , and subsequently made a lower low at 13.915. Let us wait price action.

Friday, October 30, 2015

Nifty Bi-Monthly Chart 1996-2015 :Update # 2

Further to my earlier post  http://lalitlk-lalit-lk.blogspot.com/2015/06/nifty-bi-monthly-chart-1996-2015.html, I am sharing my observation as on 30th October 2015


 As such, using a zoomed view over last 119 candles fulfilling the minimum requirement :

I am sharing crucial Macd (5,34,5) data  for certain days ; IMHO in these higher degree Elliot Wave , Nifty had done its peak for the time being as shown by a higher Nifty with lower Macd readings.


A higher high in December 2015 with next candle with closing at/over 9801  shall result in the histogram being rendered positive. I am not expecting that high this year

Sunday, October 25, 2015

CNX-Nify-index-time-frame-cycles-of-21 : Up date #2

Further to my earlier blog http://kolkatabull.blogspot.in/2015/03/cnx-nifty-index-time-frame-cycles-of-21.html , I had up dated my excel sheet & revised the Data thoroughly. Here is a chart covering the full of NSE Data ; initial closing basis data over 21 days were used to create OHLC data & subsequently data were suitablelally modified to incorporate OHLC data available with 
3rd November 1995 , resulting in a chart with 291 candles (last one in progress till 02/11/2015) :-
  

Here are zoomed view of 150 candle with Macd (5,34,5) of the Index initial stage :


Next, I had filtered out the initial candles for which Macd are not available due to default requirements ; divergence in price action with Macd leads to crossing of the zero line :-


Next I am sharing subsequent data with an up swing :


And finally , in my HO Nifty looks topped out for the time being : -


Tuesday, September 1, 2015

Silver $ Chart : Time Frame Fortnightly Update # 1

IMHO, Silver looks at the fag end of (B) with low of 13.97 in August 2015 {79.1% of (A) done} & likely to get support from TL from 5.52-8.41 rising projection around 12.8  ; let us watch for termination .


Here is a closer views in a 150 candles from same Data : a wedge & triple bottom is being observed


In the next chart, we are viewing moves more closely in 12 hourly chart; notice fall from 17.77 to 14.38 was retraced to the extent of 38.2% , and a divergence between chart & Macd , & duely falling with crossing of the zero line. Let us wait price action.


(C) wave is estimated to give a minimum of  61.8% of (A) { 27.97 } to a very higher value in the next up move.

Monday, August 31, 2015

Nifty Bi-Monthly Chart 1996-2015 : An Update

Nifty Index is being compiled since 02/07/1990 ; as such, a Time Frame of Bi-Monthly (Open, High, Low & Close over a period of two months for the Index) cover the full range of the Index since inception , starting August 1990 & ending on today,  in 151 candles is shown herein.


MACD (5,34,5) is not available for the first 39 candles due to default Data requirement. As such, using a zoomed view over last 117 candles fulfilling the minimum requirement :

I am sharing crucial Macd (5,34,5) data  for certain days (inclusive Milestone numbers ) ; IMHO in these higher degree Elliot Wave , Nifty had done its peak for the time being as shown by a higher Nifty with lower Macd readings.

Next candle with closing at/over 9482 shall result in the histogram being rendered positive  or we may to wait longer. 

Sunday, August 2, 2015

Silver - $/Oz : Fortnightly Chart

After a life time high in 1980's , Silver remained in bear grips over a long period.


Over the last 15 years, I observed there appears a ABC pattern in weekly chart ; as its retracement from last high of 49.79 is best to be viewed in a fortnightly chart. Accordingly, I had sourced the weekly Data from NetDania.com to an excel file & there after created a fortnightly . Here is the resultant chart with Macd (5,34,5) :

 
IMHO, Silver looks at the fag end of (B) & likely to get support from TL from 5.52-8.41 ; let us watch for termination . (C) wave is estimated to give a minimum of  61.8% of (A) { 27.97 } to a very higher value in the next up move.

Here is a closer views in a 150 candles from same Data : a wedge & double bottom is being observed.

Tuesday, June 30, 2015

Nifty Bi-Monthly Chart 1996-2015 : Observation on Macd Histogram

Further to my blog:

http://lalitlk-lalit-lk.blogspot.in/2015/06/nifty-bi-monthly-chart-1996-2015.html,

my observation on the Macd Histogram may look interesting in the sense that a cross over of the zero line were of  a gap  of 1 to 20 periods of  duration 2 months ; 2 cases of 1 (showing short duration ; inclusive just concluded ) & 2 cases of 2 :


Next table summarised value on diverse dates :


 Note that a closing of 9215 or higher on end of August 2015 may render the Histogram to a positive value. 

Nifty Bi-Monthly Chart 1996-2015

Nifty Index is being compiled since 02/07/1990 ; as such, a Time Frame of Bi-Monthly (Open, High, Low & Close over a period of two months for the Index) cover the full range of the Index since inception.  Full range Chart in 150 candles is shown herein.


Full data is being shared in FaceBook group "Daily_Nifty" as per link : 

https://excel.office.live.com/x/ExcelView.aspx?FBsrc=https%3A%2F%2Fwww.facebook.com%2Fattachments%2Ffile_preview.php%3Fid%3D1655964577958570%26time%3D1435671266%26metadata&access_token=1835286898%3AAVJSrcu7hwPKuXyQJ3Q742WoEnGe_8LGBQBeq3BMUihpmQ&title=DN_Nifty-Bi-Monthly2015.xlsx

MACD (5,34,5) is not available for the first 39 candles due to default Data requirement. As such, using a zoomed view over last 113 candles fulfilling the minimum requirement :


I am sharing crucial Macd (5,34,5) for certain days (inclusive first 2K etc) ; IMHO in these higher degree Elliot Wave  Nifty had done its peak for the time being as shown by a higher Nifty with lower Macd readings.


Tuesday, June 16, 2015

CNX NIFTY INDEX Time Frame : Cycles of 21 days - Update # 2

Here I have up dated my views on my earlier blog entitled :
http://kolkatabull.blogspot.in/2015/03/cnx-nifty-index-time-frame-cycles-of-21.html


IMHO, for the wave originating from 920 (October 2002), top had been made at 9119, based on Elliot Oscillator aka Macd (5,34,5) . Here is a list of the some crucial points & corresponding values.


Tuesday, June 9, 2015

MSCI India : with RONW analysis

MSCI_Index is closely followed by FII's
comprised of SENSEX ( but for Axis, HDFC Bank & Maruti) & others. On a recent review with RONW , it was found that out of 71 constituents, 27 entities (with a cumulative weight of 28.31%) were not earning 12% in RONW and may be considered to be EVA negative. Further, 14 constituents  (with a cumulative weight of 29.73%) were a bit better with  earning in the range of  12-15% in RONW.

Rest 30 are truly BLUE CHIPS yielding 15% or more in RONW & are may be classified to be Economic Value Adders :


Book value  & trailing 12 Months EPS were sourced from Screener.in

Friday, May 29, 2015

How to create a Diverse Time Frame Chart : An Innovative Idea

Why  do one need  a "Diverse Time Frame"  ?

It is seen that for 'Elliot Wave Oscillator" to be studied properly , for high-low, number of candles in a chart should be in the range of 120-150 .

http://www.tradingfives.com/articles/elliott_oscillator.htm

For the instant case (UPL) from a low 101.55 (daily candle #267, date 13/11/12) to high 568.4 (daily candle #922, date 26/05/15) number of candles is found to be 655. From sourced (NSE) data , available since 24/10/2011, I decided to go for a  6 Days Cycle based on that.
   
The excel is being shared in group "Daily_Share" in Facebook platform :

Go to: (May consider "copy & paste in a browser" if it does not open here)

https://excel.office.live.com/x/ExcelView.aspx?FBsrc=https%3A%2F%2Fwww.facebook.com%2Fattachments%2Ffile_preview.php%3Fid%3D923353207710314%26time%3D1432954300%26metadata&access_token=1835286898%3AAVJnD-aryKilTCYqdi1HJyNmB5RJezY5Ng95Nlk6HIsAgQ&title=DS_UPL_TF_6DC.xlsxhttps://excel.office.live.com/x/ExcelView.aspx?

Step # 1 : First source OHLC data from any source ; copy relevant date in cells F,G, H , I (use function" Max")  ,J (use function" Min" ) & K from a set of data , e.g., 


Step # 2 : Write in formula for EMA_5 in Cell K in row 33, e.g.,


Step # 3 : Write in formula for EMA_34 in Cell L in row 207, e.g.,

Step # 4 : Write in formula for MACD  in Cell M in row 207, e.g.,


Step # 5 : Write in formula for MACD_Signal  in Cell N in row 231, e.g.


Step # 6 : Write in formula for MACD_Histogram  in Cell O in row 231, e.g.


Step # 7 :  Finally copy suitably full range inclusive BLANKS & paste to cover the full range of your Data Use excel to create your desired Chart , e.g., 

O(pen)H(igh)L(ow)C(lose)

Step # 8 :   Use excel to create your desired other Chart , e.g., 

MACD (5,34,5)


Saturday, May 23, 2015

CNX NIFTY INDEX Time Frame : Cycles of 21 days - Update # 1

Here I have up dated my views on my earlier blog entitled :
http://kolkatabull.blogspot.in/2015/03/cnx-nifty-index-time-frame-cycles-of-21.html

In this Chart I examined the first 150 candles from my excel aided data base. What is being represented by 5EMA & 34EMA  are shown. My overall impression is based on Elliot Wave Oscillator aka Macd (5,34,5). Initially my findings are inconclusive.

" Wave 5 often makes a new high or low price for the swing but always diverges from the Oscillator. If the suspected Wave 5 makes a new extreme price simultaneously with a new Oscillator extreme then it is not a Wave 5 " according to http://www.tradingfives.com/articles/elliott_oscillator.htm
If Nifty closes at/above 8874 , in TF of 21 days cycle, on 19/05/2015, Macd & Macd histogram shall be above that during W3 peak thereby W5 shall be invalidated; however, Macd corresponding to supposed '5' remained below that for supposed '3' & further the histogram had turned negative with a value of (161) { minus 161} . My  Iabel are as in the chart :


IMHO Nifty had topped out for the time being & presently wave  A in retracement of big up move of 9119-920 = 8199 is in play.  


Wednesday, May 20, 2015

CNX Nifty : TF of 6 days


It is seen that Nifty had move from 4531 to all time high at 9119 , herein , below a weekly chart :

Number of Weekly candles covering this range is 167 .
  
Q " "The Elliott Oscillator is most effective when the chart has the "correct" number of bars. From 100 to 150 bars is the correct number of bars to use with the oscillator. Dr. Bill Williams suggests 100-140. Tom Joseph implies that 150 is right. We like to use about 120 bars, which is comfortably in the middle of that range, and which has consistently produced reliable results."

For covering NIFTY from 4531 to ATH 9119,it is being felt that a cycle of 6 days based on NSE data for OHLC  would be helpful to determine the status of  the wave in the light of the Elliott Oscillator Macd (5,34,5). Accordingly, here is the excel derived Chart with candle # 149 ( 6DC period ended on 19/05/2015)  & last candle in progress to terminate on 27/05/2015.

The most important single concept about the Elliott Oscillator is that the highest/lowest point of the Oscillator is connected to the bullish/bearish Wave 3 of the swing.  Related concepts are that Wave 4 crosses the zero line in the opposite direction of the trend. 


Friday, May 8, 2015

Nifty TF 225 Minutes for the Period ending on 8th May 2015

I had been looking at Nifty chart with time frame 75 minutes lately. It covers 30 days of moves with 150 candles. Latest Chart is being shared :


However, last week's moves could not be seen with earlier similar price range with in 150 candles. Here is a broad view , however, with candles exceeding 150, E W Oscillators are not  "appropriate" .


A TF225 minutes cover 3 days moves with 5 candles ; as such a chart of 150 candles cover 90 days with proper  &  "appropriate"  Macd . Chart is being shared (please note that last candle in progress to end at 11:45 Monday ) 
 . 

Saturday, May 2, 2015

Bi-Monthly CNX Nifty with Elliot Wave Oscillators : A review for PE April 2015


Up dated version of Excel incorporating Bi-Monthly OHLC ( being Open of range, Highest of range, Lowest of range, and Close of range ) may be accessed :

https://excel.office.live.com/x/ExcelView.aspx?FBsrc=https%3A%2F%2Fwww.facebook.com%2Fattachments%2Ffile_preview.php%3Fid%3D302478353209742%26time%3D1430622879%26metadata&access_token=1835286898%3AAVKCq7AnsaHYbT2fee5uuAYFseY-S1jnsRgNS_oBaPqICg&title=CNX+NIFTY_BiMonthly_Public-2015.xlsx


While Nifty index is being compiled since 03/07/1990, it is being based on OHLC basis with effect from 03/11/1995. Here in, I had created a Bi-Monthly Data aided by excel  & sharing my observations. First, Chart based on the Data :


Macd (5,34,5) were then calculated on usual basis and resultant chart is :


Based on my understanding of EW Oscillators, Nifty is in 5th wave of high degree wave starting in April 2003. It is essential that current Macd does NOT cross the earlier high.


Highest Histogram (419) is based on closing value of 5201 (December 2009). On hypothetical closing as on 30/06/2015 of 10300 (a figure being talked of - near parallel of a TL October 2008), it shall be 280 ; similarly based on highest closing (8902) & closing =Highest (9119), it shall be 22 & 62 respectively. However, if closing is  8781 or lower , it shall turn NEGATIVE & if Vipani's suggested value (7936) be closing , it shall be (156)