Nifty Index is being compiled since 02/07/1990 ; as such, a Time Frame of Bi-Monthly (Open, High, Low & Close over a period of two months for the Index) cover the full range of the Index since inception. Full range Chart in 150 candles is shown herein.

https://excel.office.live.com/x/ExcelView.aspx?FBsrc=https%3A%2F%2Fwww.facebook.com%2Fattachments%2Ffile_preview.php%3Fid%3D1655964577958570%26time%3D1435671266%26metadata&access_token=1835286898%3AAVJSrcu7hwPKuXyQJ3Q742WoEnGe_8LGBQBeq3BMUihpmQ&title=DN_Nifty-Bi-Monthly2015.xlsx
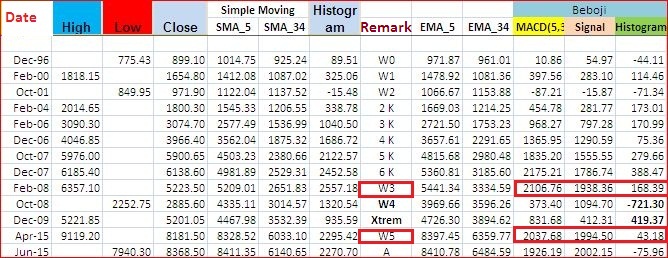
MACD (5,34,5) is not available for the first 39 candles due to default Data requirement. As such, using a zoomed view over last 113 candles fulfilling the minimum requirement :


Full data is being shared in FaceBook group "Daily_Nifty" as per link :
https://excel.office.live.com/x/ExcelView.aspx?FBsrc=https%3A%2F%2Fwww.facebook.com%2Fattachments%2Ffile_preview.php%3Fid%3D1655964577958570%26time%3D1435671266%26metadata&access_token=1835286898%3AAVJSrcu7hwPKuXyQJ3Q742WoEnGe_8LGBQBeq3BMUihpmQ&title=DN_Nifty-Bi-Monthly2015.xlsx
MACD (5,34,5) is not available for the first 39 candles due to default Data requirement. As such, using a zoomed view over last 113 candles fulfilling the minimum requirement :

I am sharing crucial Macd (5,34,5) for certain days (inclusive first 2K etc) ; IMHO in these higher degree Elliot Wave Nifty had done its peak for the time being as shown by a higher Nifty with lower Macd readings.
No comments:
Post a Comment