Total Pageviews

Sunday, May 29, 2016

Merger SBI Subsidiaries : Likely ratio for Listed Subsidiaries

All subsidiaries of State Bank are going to be merged with SBI : let us speculate about the likely ratio for listed subsidiaries, e.g., SBBJ, SBT & SBM. First, silent financial position of SBI individually is :


Records were sourced from Moneycontrol.com but for current year (which is based on Advertisement in newspaper ).There were massive infusion of capital by the Government of India in two doses - details as per attachment :

But for this financial position as on 31/03/2016 would have been worse. Public shareholders were saved from the inflated premiums charged on two private placements.
Of the three listed subsidiaries, State Bank of Bikaner & Jaipur appears to be robust with consistent results over the previous five years,


Records of book value & EPS are consistently good. As such, it is likely that public shareholders may get 2.38 shares of SBI (as minimum), 4.60 (higher side) & an average of 3.11 based on five years comparative performance with the holding Company. Its boards being in control of  SBI , public shareholders may cross their fingers & await the Ratio. Hopefully RBI may ensure fair dealings.


With adverse results in last 2 years & infusion of capital in 2 stages, SBT 's position had been affected.


SBM is more closely held than SBBJ & SBT.

S B Hyderabad & Patiala are fully owned by SBI.


Thursday, May 26, 2016

Nifty Time Frame 75 Minute Charts for May 2016

First let us review a Nifty Daily chart , generated from Netdania :


Chart from 01/12/2015 to 26/05/2016 with Macd (5,34,5).


Next is fractal TF 75 minute chart covering said period in 600 candles.


Next is zoomed view in 150 candle over 30 days ending on 26/05/2016.


Monday, May 23, 2016

Nifty-bi-monthly-chart : An intermediate report for PE June 2016

Further to my earlier blog

http://lalitlk-lalit-lk.blogspot.in/2016/05/nifty-bi-monthly-chart-review-of-elliot.html

an interim report, chart as on 23/05/2016 is depicted :


With reference to my impression of top being made at 9119, please refer to :


it looks corrective A at 6825.8 had retraced #1  49.9% of up move from 4531 ; next fibonacci level to be watched is 6285 (may be eventual C) ; and #2  33.4% of up move from 2252.75 leaving next fibonacci lvl of 6497 worthy of being watched . 


B-wave had recovered 74.4% of previous decline at 7992 ; 8242 may be a high that need not be ruled out.

Macd (5,34,5) in Bi-Monthly suggest a topping by its value (2166 , corresponding to 9119), been lower than that earlier (2175) . However, macd in 21 DaysCycle do not endorse that topping.

Let us watch price actions specially near the trend line marked in both log scale chart.

IMHO a dip of zero line is due heralding easiness in short-term EMA (5) over long-term EMA (34).  


Monday, May 16, 2016

Nifty 8 Days Cycle : A fractal of Bi-monthly (Rejoinder 1)

 Let us try to study broad views with fractals


Nifty BiMonthly (Last candle in progress June 2016)

http://lalitlk-lalit-lk.blogspot.in/2016/05/nifty-8-days-cycle-fractal-of-bi-monthly.html

Rectangle marked in red is being studied with fractal of 8 DaysCycle :


To my novice eyes, it is more of a,b moves rather than conventional Elliot waves . More observations in chart.

Thursday, May 5, 2016

Nifty 8 Days Cycle : A fractal of Bi-monthly


Further to my blog :

http://lalitlk-lalit-lk.blogspot.in/2016/05/nifty-bi-monthly-chart-its-fractal-8.html

I shall like to share some observations :


Macd-wise both Bi-Monthly & 8 Days Cycle Charts showed that Nifty may have topped out at 9119. Usual high in Macd was duly followed by cross down of the ZL, subsequent rise was with lower Macd characteristic of the 5th wave. In the Chart above tried to present views from different time frames. 


Above chart, with full range of Data available & suitably re-cast, Next are zoomed views of Nifty TF 8 Days Cycle with proper Macd in four split charts with 188 candles (1st) & rest 3 with 150 candles for proper analysis.


Zoomed Views (188 Candles)


Zoomed view (2nd Part)


Zoomed view (3rd Part)


Zoomed view (Final Part)


Tuesday, May 3, 2016

Nifty-bi-monthly-chart & its Fractal 8 DaysCycle

Present is a rejoinder to my blog :

http://lalitlk-lalit-lk.blogspot.in/2016/05/nifty-bi-monthly-chart-review-of-elliot.html

it may be said that a candle in Bi-Monthly chart covers on an average of 41 days.  For ready reference, chart is reproduced :


Next is a chart of time frame of 8 DaysCycle  effectively covering the Bi-Monthly chart as a fractal :


As such 5 candles in TF 8DC cover each candle in Bi-Monthly .

Elliot wave oscillator aka MACD (5,34,5) views from both sets of charts are complementary & endorse the view that 9119 is a peak


Zoomed views of TF 8DC in 300 & 150 candles are given below :


Chart in 300 Candles


Chart in 150 Candles


Sunday, May 1, 2016

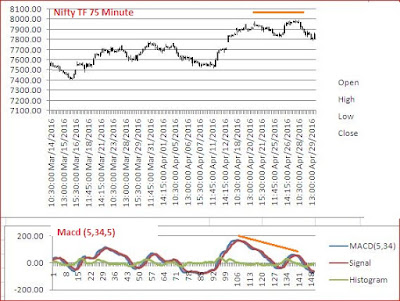
Nifty Time Frame 75 Minute Charts for April 2016


Here are a few charts (sorry missed a number of days due to snag in my excel) :


Nifty-bi-monthly-chart : A review of Elliot wave oscillator aka Macd

Nifty Index is being compiled since 02/07/1990 ; as such, a Time Frame of Bi-Monthly (Open, High, Low & Close over a period of two months for the Index) cover the full range of the Index since inception.

Basic data had been shared in a FaceBook group "Daily_Nifty" :
https://excel.office.live.com/x/ExcelView.aspx?FBsrc=https%3A%2F%2Fwww.facebook.com%2Fattachments%2Ffile_preview.php%3Fid%3D1131478423571184%26time%3D1462100798%26metadata&access_token=1835286898%3AAVIHzGtAdv1r57l1XTyf0nrYxxxxf5TN3IKTvrYF4ca8qw&title=DN_Nifty-Bi-Monthly2016.xlsx

Chart based on this data with MACD (5,34,5) aka Elliot wave oscillator for period from 01/09/1996 to 29/04/2016 is here in below :


http://www.tradingfives.com/articles/elliott_oscillator.htm have covered the concept amply ; point to be noted is 5th wave, in a extreme degree over 19 years, had been made.