Nifty Index is being compiled since 02/07/1990 ; as such, a Time Frame of Bi-Monthly (Open, High, Low & Close over a period of two months for the Index) cover the full range of the Index since inception.
Basic data had been shared in a FaceBook group "Daily_Nifty" :
https://excel.office.live.com/x/ExcelView.aspx?FBsrc=https%3A%2F%2Fwww.facebook.com%2Fattachments%2Ffile_preview.php%3Fid%3D1131478423571184%26time%3D1462100798%26metadata&access_token=1835286898%3AAVIHzGtAdv1r57l1XTyf0nrYxxxxf5TN3IKTvrYF4ca8qw&title=DN_Nifty-Bi-Monthly2016.xlsx
Chart based on this data with MACD (5,34,5) aka Elliot wave oscillator for period from 01/09/1996 to 29/04/2016 is here in below :

http://www.tradingfives.com/articles/elliott_oscillator.htm have covered the concept amply ; point to be noted is 5th wave, in a extreme degree over 19 years, had been made.

In the next chart, Nifty Bi-Monthly close along with EMA's & Macd arising thereof are being presented; after a prolong period of 32, showing short term EMA_5 being greater than long term EMA_34, oscillator dip below zero line (in confirmation of 4th wave) & regained strength & is continued to be positive territory presently.

Next is a monthly Nifty chart covering the same period sourced from NetDania.com ; notice a short dip in Macd & then back to positive territory.
I am presenting three other Time Frame Chart of 34 DaysCycle, 21 DaysCycle & 13 DaysCycle here in :
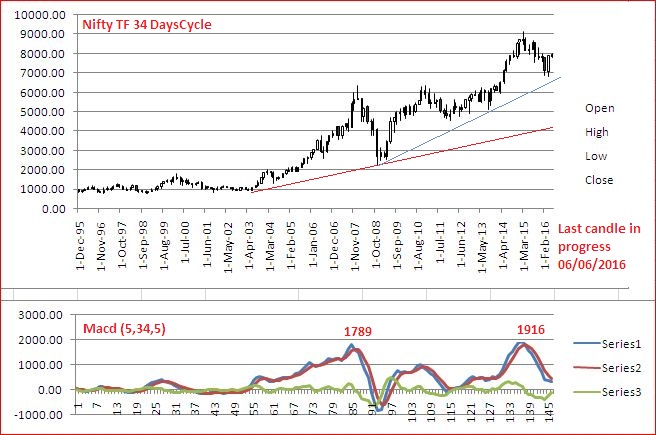
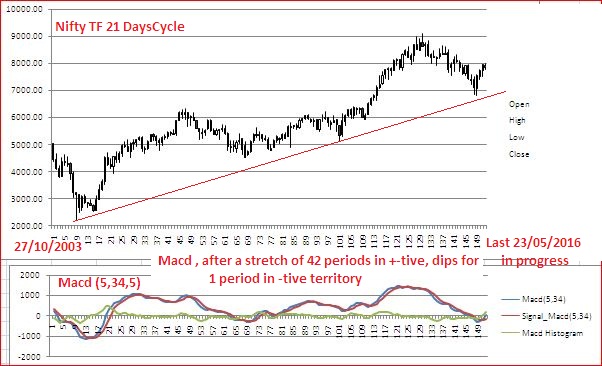

Suggestions as regards wave natures are rather contradictory. Please use your knowledge to make your own conclusion.
My impression is Nifty may not see the earlier high very soon (at least in rest of the year)
No comments:
Post a Comment