Total Pageviews

Monday, August 31, 2020

Nifty : Review of long-term Charts in diverse #TimeFrame As on 31/08/2020


 I have summarized last candle  of Nifty as on #EOP (end of Period) in diverse #TF (time frame) in above Table ;  

Macd were in NEGATIVE territory, following massive 87.88% correction from #ATH (all time high) 12,430 in just 45 days, for 14 candle-session in #TF5Days, 10 in #TF8Days , 7 in #TF13 & 2 in #TF34Days and since turned POSITIVE for 10,5,3 & 1 ,respectively, thereby confirming 7511 to be an intermediate bottom. Nifty chart in #TF34Days shown:


However, Macd remains in negative in TF21Days for 6 candle-session.

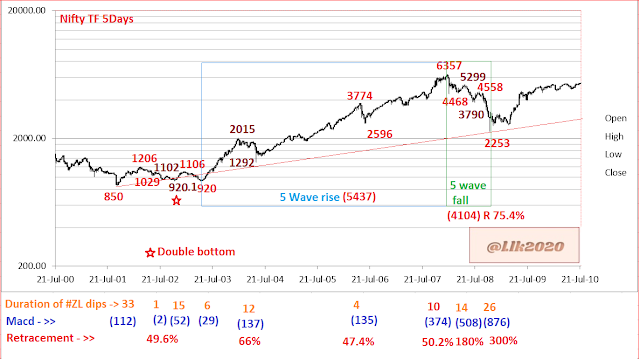
It may be noted that Nifty is basically in Bull grip but for occasional corrections [5 sessions or less below #ZL (Zero line) ] .  Next, I am sharing charts in TF5Days to show details of Nifty with more swings than that visible in long #TF34Days or like.


Thursday, April 2, 2020

Nifty : Review of long-term Charts in diverse #TimeFrame

Nifty, since inception on 3rd July 1990 , is covered in the following Chart in 131 candles of #TF55Days with Macd (5,34,5) aka #ElliotWaveOscillator :


Please refer to next chart in #TF34Days & notice the key observations :

#1 : Rise of 850-6357 was impulsive & took 46 candles in TF 34Days /28 candles in TF 55days/1580 daily candles;

# 2 : Rise of 2253-9119 took 46 candles in TF 34days/29 candles in TF 55days/1575 daily candles ;
notice that it is time-wise  EQUAL but resultant rise was expanding in nature :

let me elaborate (a) in first case rise was 5507 ; (b) in the next case rise was 6866 , being 123.6% of 5507 = 6807 plus grace of 59 points  (a small <1% deviation).

# 3 : Please notice TL279-850 (850 being the launching pad for subsequent impulsive waves ) remained untouched since June 2003 (likely to be sub-6000 in the Log chart) at present;
secondary TL850-2253 similarly untouched but for the 131st candle presently in progress ; and tertiary TL4531-6826 similarly untouched but for being breached in last candle.

In the Table I have listed Macd etc in diverse #TF (when lows of 850, 2253, & 4531 seen) , notice no #ZeroLine dip in TF55Days except for 850 low :


# 4 : Rise of 4531-12430, resulting in a rise of 7899 points, was done in 59 candles in #TF34days/ 36 candles in TF55Days / 2002 Daily candles ; notice rise had slowed down in view of  114.6% of 6866 being = 7868 plus a small deviation of 31 but time taken being expanding because 123.6% of 1575 = 1947 plus a small deviation of 55.

I shall share soon EOP macd Chart .


Monday, January 27, 2020

Step Sum study of Nifty : 2019


Step Sum is in the form of a new technical tool to evaluate the psychology of the market. It has been developed by Mark Lundeen and it offers a unique insight into the psychology of the market. The step sum is simply a running total of UP vs. DOWN  days and it reflects trader psychology.
The step sum is a single item Advance – Decline Line. In other words; if Nifty is down from the previous day’s close, we give it a value of (-1), if they end the day up from the previous day’s close, we give it a value of (+1). So a step sum plot is merely the net sum of up and down market days over time.
Initially, step sum fluctuated in negative zone as Nifty dipped below 1000 (Arbitrarily set as OHLC available from 1st November 1995) for considerable period & then remained in positive since PE August 2002; a graph is shared here in below:


There were seven occasions when Nifty showed Zero change over the previous day’s closing & listed below : 


A Chart of Nifty Close-StepSum (on ‘end of month’ basis) is shared below: 


Next is a Chart (on ‘end of Year’ basis) is shared below:


 “15 Count” is  running sum of the daily step used in constructing their step sum over consecutive 15 days. As for example,
 Count +/-  13”  means 14 up (down) & 1 Down(up),
“Count +/-  11”  means 13 up (down) & 2 Down(up),
“Count +/-  9”  means 12 up (down) & 3 Down(up),
and so on
“Count +/-  1”  means 8 up (down) & 7 Down(up)
Now I am trying to measure the "Quality aspect" of Step sum with a simple logic & mathematics ; simply stated here is a plan to quantify the sum of all 'Count of 15' over a period of calendar year. First refer to the Table :


Table is based on OHLC data sourced from NSE site. Step sum were calculated on daily basis, thereafter, 'Count of 15' were generated by excel (by adding step up or step down days over 15 days). Thereafter, total number of occasions for diverse Cnt_15 are tabulated in the Table.
Note there had been 7 cases of 'no change' in closing Nifty , resulting in 0 change in Step Sum; consequently 'Count of 15' were rendered even numbers ; such cases were added to nearest odd number (e.g., 2 were counted with 1, 4 with 3, etc)

Z (Sigma) = Net weighted Count_15 for the Year =
 Summation over the year of  [ (Number of count) X (Value of Cnt) ]  for full range of  available Cnt  { from 15 to minus 15 } with the help of Template shared below :

A Chart showing correlation of the derived value for Z (Sigma) with year-end incremental value for Step Sum is shared below:


Ratio is found to be Median value of 1.80 & Average value of 2.50 even though broad range is wide from peak of 4.20 to low of 0.62.