Total Pageviews

Showing posts with label BiMonthly. Show all posts

Monday, August 31, 2020

Nifty : Review of long-term Charts in diverse #TimeFrame As on 31/08/2020


 I have summarized last candle  of Nifty as on #EOP (end of Period) in diverse #TF (time frame) in above Table ;  

Macd were in NEGATIVE territory, following massive 87.88% correction from #ATH (all time high) 12,430 in just 45 days, for 14 candle-session in #TF5Days, 10 in #TF8Days , 7 in #TF13 & 2 in #TF34Days and since turned POSITIVE for 10,5,3 & 1 ,respectively, thereby confirming 7511 to be an intermediate bottom. Nifty chart in #TF34Days shown:


However, Macd remains in negative in TF21Days for 6 candle-session.

It may be noted that Nifty is basically in Bull grip but for occasional corrections [5 sessions or less below #ZL (Zero line) ] .  Next, I am sharing charts in TF5Days to show details of Nifty with more swings than that visible in long #TF34Days or like.


Wednesday, February 28, 2018

Nifty - TF Bimonthly 2018

Supplement as on 28th February 2018 to my earlier blog http://lalitlk-lalit-lk.blogspot.in/2017/03/nifty-bimonthly-as-on-february-2017.html with charts up dated :


Next, let us review Macd (5,34,5) in details as in attachment :

Notice Macd were mostly in positive territory signifying EMA_5 being greater than EMA_34 (including current phase of 52 candles post dip of 2253).  Based on EWO , Nifty had a 3rd wave characteristic top at 6357, 4th wave bottom at 2253 & subsequent 5th wave unfurling in 5 wave Macd remaining smaller than extreme value of 2175 corresponding to Nifty 6357.

Let us examine Macd post dip of 2253 in a fractal #TF5DaysCycle #Nse #Nifty chart :


Following tables may be referred for better understanding of chart detailing phases of Macd in positive territory with alternate bouts of less period in negative territory.


No clue for #ZeroLine dip in even #TF5DaysCycle (1111 candles available) leave aside such in bigger #TF.

Saturday, March 4, 2017

Nifty BiMonthly : As on February 2017

Further to my earlier blog :

http://lalitlk-lalit-lk.blogspot.in/2016/06/nifty-bi-monthly-chart-intermediate.html ,  it is time to share the current status on the same time frame : 
that a "Bi-month" is of average 42 days  & being consisting calendar months of various duration. As such short term EMA_5 covers 10 months & long term EMA_34 covers
68 months = 5 years 8 months.

Latest chart :
IMO B is either in progress or may have topped out and in that case C is in progress.

Since 2003 Nifty is prevailing over long term EMA_34 most of the time but for a significant (marked box) below it for a few months post dip of 2253 & also dip of 4531. But for these Nifty is in bull grip for over 14 years now.

Let us have a shorter term review of Nifty in TimeFrame of 5DaysCycle & 8DaysCycle ;

Here 34EMA is of 170 days  , appr 4 BiMonthly candle


Here 34EMA is of 272 days  , appr 7 BiMonthly candle .
And a longer time 34DaysCycle chart :
Here 34EMA is of 1156 days  , appr 27.5 BiMonthly candle .


Sunday, May 1, 2016

Nifty-bi-monthly-chart : A review of Elliot wave oscillator aka Macd

Nifty Index is being compiled since 02/07/1990 ; as such, a Time Frame of Bi-Monthly (Open, High, Low & Close over a period of two months for the Index) cover the full range of the Index since inception.

Basic data had been shared in a FaceBook group "Daily_Nifty" :
https://excel.office.live.com/x/ExcelView.aspx?FBsrc=https%3A%2F%2Fwww.facebook.com%2Fattachments%2Ffile_preview.php%3Fid%3D1131478423571184%26time%3D1462100798%26metadata&access_token=1835286898%3AAVIHzGtAdv1r57l1XTyf0nrYxxxxf5TN3IKTvrYF4ca8qw&title=DN_Nifty-Bi-Monthly2016.xlsx

Chart based on this data with MACD (5,34,5) aka Elliot wave oscillator for period from 01/09/1996 to 29/04/2016 is here in below :


http://www.tradingfives.com/articles/elliott_oscillator.htm have covered the concept amply ; point to be noted is 5th wave, in a extreme degree over 19 years, had been made.

Monday, August 31, 2015

Nifty Bi-Monthly Chart 1996-2015 : An Update

Nifty Index is being compiled since 02/07/1990 ; as such, a Time Frame of Bi-Monthly (Open, High, Low & Close over a period of two months for the Index) cover the full range of the Index since inception , starting August 1990 & ending on today,  in 151 candles is shown herein.


MACD (5,34,5) is not available for the first 39 candles due to default Data requirement. As such, using a zoomed view over last 117 candles fulfilling the minimum requirement :

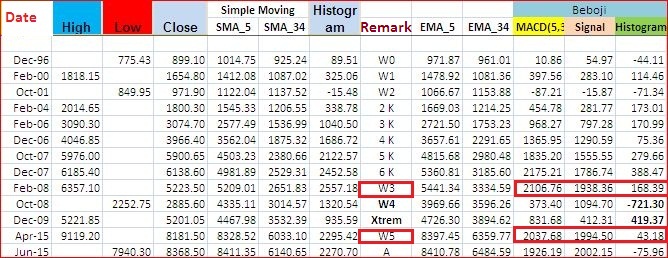
I am sharing crucial Macd (5,34,5) data  for certain days (inclusive Milestone numbers ) ; IMHO in these higher degree Elliot Wave , Nifty had done its peak for the time being as shown by a higher Nifty with lower Macd readings.

Next candle with closing at/over 9482 shall result in the histogram being rendered positive  or we may to wait longer. 

Tuesday, June 30, 2015

Nifty Bi-Monthly Chart 1996-2015 : Observation on Macd Histogram

Further to my blog:

http://lalitlk-lalit-lk.blogspot.in/2015/06/nifty-bi-monthly-chart-1996-2015.html,

my observation on the Macd Histogram may look interesting in the sense that a cross over of the zero line were of  a gap  of 1 to 20 periods of  duration 2 months ; 2 cases of 1 (showing short duration ; inclusive just concluded ) & 2 cases of 2 :


Next table summarised value on diverse dates :


 Note that a closing of 9215 or higher on end of August 2015 may render the Histogram to a positive value. 

Nifty Bi-Monthly Chart 1996-2015

Nifty Index is being compiled since 02/07/1990 ; as such, a Time Frame of Bi-Monthly (Open, High, Low & Close over a period of two months for the Index) cover the full range of the Index since inception.  Full range Chart in 150 candles is shown herein.


Full data is being shared in FaceBook group "Daily_Nifty" as per link : 

https://excel.office.live.com/x/ExcelView.aspx?FBsrc=https%3A%2F%2Fwww.facebook.com%2Fattachments%2Ffile_preview.php%3Fid%3D1655964577958570%26time%3D1435671266%26metadata&access_token=1835286898%3AAVJSrcu7hwPKuXyQJ3Q742WoEnGe_8LGBQBeq3BMUihpmQ&title=DN_Nifty-Bi-Monthly2015.xlsx

MACD (5,34,5) is not available for the first 39 candles due to default Data requirement. As such, using a zoomed view over last 113 candles fulfilling the minimum requirement :


I am sharing crucial Macd (5,34,5) for certain days (inclusive first 2K etc) ; IMHO in these higher degree Elliot Wave  Nifty had done its peak for the time being as shown by a higher Nifty with lower Macd readings.


Saturday, May 2, 2015

Bi-Monthly CNX Nifty with Elliot Wave Oscillators : A review for PE April 2015


Up dated version of Excel incorporating Bi-Monthly OHLC ( being Open of range, Highest of range, Lowest of range, and Close of range ) may be accessed :

https://excel.office.live.com/x/ExcelView.aspx?FBsrc=https%3A%2F%2Fwww.facebook.com%2Fattachments%2Ffile_preview.php%3Fid%3D302478353209742%26time%3D1430622879%26metadata&access_token=1835286898%3AAVKCq7AnsaHYbT2fee5uuAYFseY-S1jnsRgNS_oBaPqICg&title=CNX+NIFTY_BiMonthly_Public-2015.xlsx


While Nifty index is being compiled since 03/07/1990, it is being based on OHLC basis with effect from 03/11/1995. Here in, I had created a Bi-Monthly Data aided by excel  & sharing my observations. First, Chart based on the Data :


Macd (5,34,5) were then calculated on usual basis and resultant chart is :


Based on my understanding of EW Oscillators, Nifty is in 5th wave of high degree wave starting in April 2003. It is essential that current Macd does NOT cross the earlier high.


Highest Histogram (419) is based on closing value of 5201 (December 2009). On hypothetical closing as on 30/06/2015 of 10300 (a figure being talked of - near parallel of a TL October 2008), it shall be 280 ; similarly based on highest closing (8902) & closing =Highest (9119), it shall be 22 & 62 respectively. However, if closing is  8781 or lower , it shall turn NEGATIVE & if Vipani's suggested value (7936) be closing , it shall be (156)


Sunday, January 5, 2014

Nifty : Bi-Monthly Chart (1990-2013)

Nifty Index is being compiled since 03/07/1990, initially on closing basic only. O H LC is being compiled with effect from 03/11/1995.
 As data is limited, I am making a "Bi-Monthly" chart instead so that we have a Chart since inception.https://docs.google.com/spreadsheet/ccc?key=0Av41dGrpKfhMdEp1RzZvQUFmbVBERGhSNy1RelNSeWc#gid=0


Milestone day of Nifty Index on reaching 1-6 K ; 7K is evasive for a pretty long time . Further, details of single day candles of 1000 points or more also tabulated.