Total Pageviews

Showing posts with label wolfw wave. Show all posts

Saturday, June 9, 2012

Why +ww set up fail ?


“Whenever a trend line is broken, it is almost a guarantee that you will find a Wave. Initially, heavy selling drops the price below support of the trend line. As the price struggles to get back,it meets resistance. The ingredients are in place and the motion acts naturally and forms a Wave (See greenish volume indicator).”

“What I do is parallel points 2 and 4 to point 3 and in some cases point 1. The area from the price of point 3, to the parallel of points 2 and 4 to point 3 is the sweet zone. This can be extremely valuable as it alerts you to potential risk”

Signs that a Wave will not make it to the 1 to 4 target line.
A poorly formed Wave has less of a chance than a well formed Wave. If volume is not relatively heavy (see red line) at the 5 point, you should be suspicious. As the price reverses, the volume should decrease. If it does not, move to a shorter time frame and be on the look out for a contrary Wave forming. Get out at the first sign of trouble and wait for the next Wave to form. If you entered in the ‘sweet zone’ you probably have a profit anyway.”
Had used " ..." as all remarks are in the language of Bill Wolfe.

Monday, May 7, 2012

Nifty: A wolfe wave Set-up


Point 2 is the initial starting point for the pattem. It is easiest to start the count at this point. Then, backtrack and find point 1 and 3. Don't forget that point 4 must be higher than point 1. Our trend line is drawn projecting point 5. The market finds support at this level, so we enter a long position at the market and place a stop just below point 5.

The key to recognizing the setup is symmetry. Ideally, waves 1-3-5 are established with very regular timing intervals between moves. The other key ingredient is that the wave 4 should revisit the price range established by waves 1-2 for the best results. Another way to describe the pattern is that it comes as a rising wedge / channel in an uptrend, or falling wedge / channel in a downtrend. Wave 5 is often a false breakout move beyond the bounds of the pattern. Unlike either bull or bear flags, the movement is in the same direction as the overall trend, with the overlapping waves giving signals that an impending reversal is taking shape. The unique quality about wolfewaves, however, is the objective target projection from  waves 1 -> 4.


In the NSE Nifty chart, please notice that "First +ww" took 91 days to reach Point 5 & another 51days to reach Target as per EPA and overall in (91+51) 142 days ; significantly  89, 55 & 144 are Fibonacci numbers nearing these days.

In a text book set up, Nifty tooks 57 days to reach Point 5 and buy is suggested ; SIMILARITY suggests a time frame of 34 days to reach EPA, date being 06/06/12


Above is an example for wolfe wave sell set up. Point 2 is a significant swing low. Point 4 is lower than point 1. A trend line connecting 1 and 3 projects point 5 where the market meets the price objective to the tick! Again, the trade did not quite meet its projected downside target. However, there was plenty of opportunity to take some profits out of this 10-point drop.

Elliott Context : Another interesting aspect of wolfewaves is that they overlap nicely with elliott wave theory, which breaks wave counts into impulses (trend movement) and corrections. Since wolfewaves are considered reversal patterns, the elliott count should match the iii - iv - v or 3 - 4 - 5 sequence. This is the final count that is encountered before a trend changes. The expected elliott count is drawn on the hourly chart, while we ready ourselves for the equivalent wolfewave pattern on daily.

"Wolfe Wave analysis
mentally prepares you for this opportune spot that I call the “Sweet Zone.” You will know in
advance where it will take place. While others are panicking, you, after you have confidence in
this method, will calmly pick up the phone and fade the market. It may look scary, but it only
lasts for a short period of time before you have a profit." according to Bill Wolfe

Quoting from Bill Wolfe:

"Wave analysis provides very clear points where a reversal should take place and it’s greatly to your advantage to fade when in the appropriate area. By fading I mean buying into a declining market or selling into and advancing market. This usually produces positive slippage which is very rewarding monetarily and mentally."


"How to avoid scaring yourself out of a trade.
Trading is a mental challenge just as much as it is a skill. It is very important that you keep things in perspective when you are in, or about to enter a trade.
About the Tactical Notes.
Being that Waves are made up of a natural rhythm, two Waves will often look similar. It doesn’t matter that one might be a 1 minute chart and the other may be a monthly Watch for heavy tic volume.
Important turning points are often accompanied by stopping volume. As the reversal gets going, volume has a tendency to lessen and then increase again at the next stopping point. On a chart, it will have a saucer like appearance.
Look for broken trend lines.
Waves develop after a trend line is broken. It is a natural reaction for price to try to get back onto a broken trend line. The right shoulder of a head and shoulders pattern is often a potentially explosive Wolfe Wave.
Setting up your charts.
The neater your chart the easier it will be to identify the Waves. For best results I would suggest that you use a price and tic volume chart only. Please, do yourself a favor and eliminate all “jewelry”. By jewelry I mean indicators, oscillators, moving averages etc. They do nothing but clutter up the chart and add to analysis paralysis. I would suggest that you save a 5 minute and 15 minute chart for intraday trading." are WORTHY OF KEEPING IN MIND from Bill.

Monday, April 23, 2012

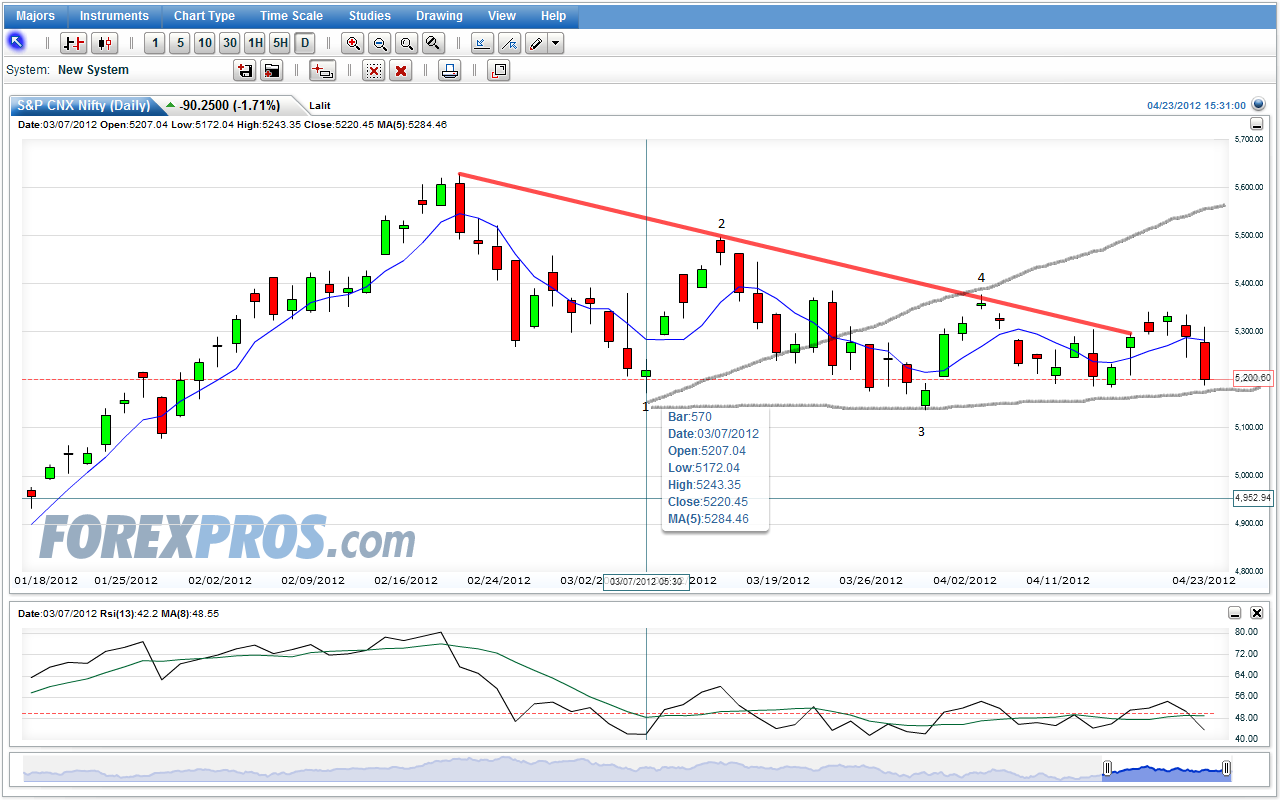
Nifty : a wolfe wave set up


1. Number 2 wave is a top.

2. Number 3 wave is the bottom of a first decline.

3. Number 1 wave is the bottom prior to wave 2 (top). Point 3 must be lower than point 1.

4. Number 4 wave is the top of wave 3. The wave 4 point should be higher than the wave 1 bottom.


Chart is conforming with the standard wolfe wave requirement.

Today's candle is poised to be the entry point for a ride to the epa line (1 to 4).  SL is 5126
(recent low - 10)


ChartNexus chart is better in drawing; first oval is point 3 & second oval is expected point 5
for a bull set up ; SL 5080