Nifty Index is being compiled since 02/07/1990 ; as such, a Time Frame of Bi-Monthly (Open, High, Low & Close over a period of two months for the Index) cover the full range of the Index since inception.
Basic data had been shared in a FaceBook group "Daily_Nifty" :
https://excel.office.live.com/x/ExcelView.aspx?FBsrc=https%3A%2F%2Fwww.facebook.com%2Fattachments%2Ffile_preview.php%3Fid%3D1131478423571184%26time%3D1462100798%26metadata&access_token=1835286898%3AAVIHzGtAdv1r57l1XTyf0nrYxxxxf5TN3IKTvrYF4ca8qw&title=DN_Nifty-Bi-Monthly2016.xlsx
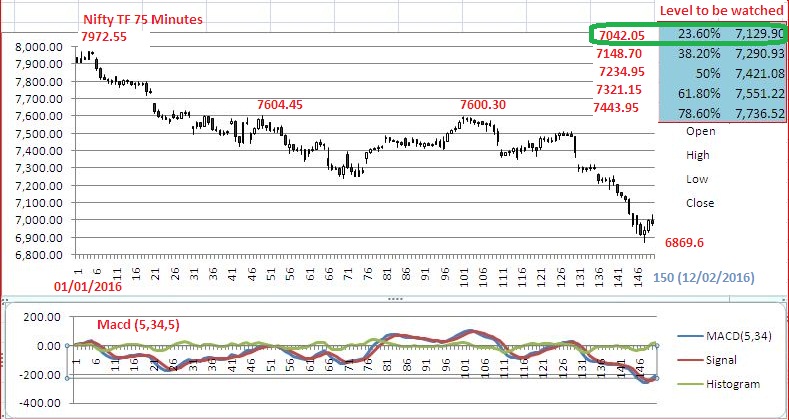
Chart based on this data with MACD (5,34,5) aka Elliot wave oscillator for period from 01/09/1996 to 29/04/2016 is here in below :


Basic data had been shared in a FaceBook group "Daily_Nifty" :
https://excel.office.live.com/x/ExcelView.aspx?FBsrc=https%3A%2F%2Fwww.facebook.com%2Fattachments%2Ffile_preview.php%3Fid%3D1131478423571184%26time%3D1462100798%26metadata&access_token=1835286898%3AAVIHzGtAdv1r57l1XTyf0nrYxxxxf5TN3IKTvrYF4ca8qw&title=DN_Nifty-Bi-Monthly2016.xlsx
Chart based on this data with MACD (5,34,5) aka Elliot wave oscillator for period from 01/09/1996 to 29/04/2016 is here in below :

http://www.tradingfives.com/articles/elliott_oscillator.htm have covered the concept amply ; point to be noted is 5th wave, in a extreme degree over 19 years, had been made.