Further to my earlier blog
http://lalitlk-lalit-lk.blogspot.in/2016/05/nifty-bi-monthly-chart-review-of-elliot.html
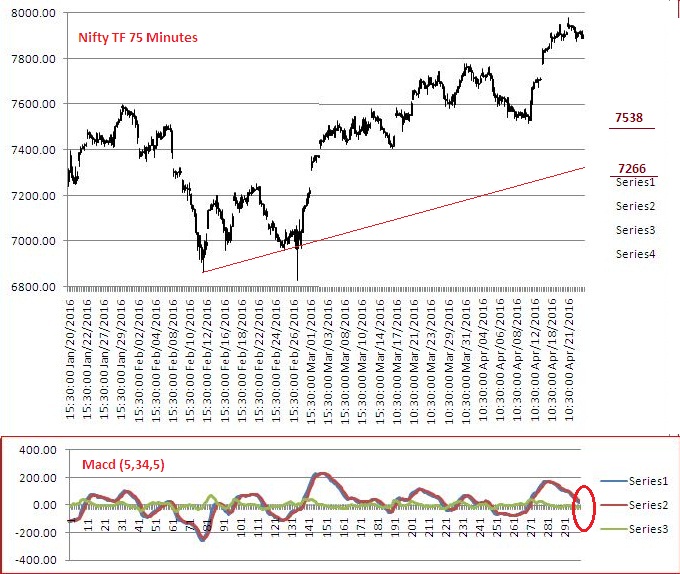
an interim report, chart as on 23/05/2016 is depicted :
With reference to my impression of top being made at 9119, please refer to :
it looks corrective A at 6825.8 had retraced #1 49.9% of up move from 4531 ; next fibonacci level to be watched is 6285 (may be eventual C) ; and #2 33.4% of up move from 2252.75 leaving next fibonacci lvl of 6497 worthy of being watched .
B-wave had recovered 74.4% of previous decline at 7992 ; 8242 may be a high that need not be ruled out.
Macd (5,34,5) in Bi-Monthly suggest a topping by its value (2166 , corresponding to 9119), been lower than that earlier (2175) . However, macd in 21 DaysCycle do not endorse that topping.
Let us watch price actions specially near the trend line marked in both log scale chart.
IMHO a dip of zero line is due heralding easiness in short-term EMA (5) over long-term EMA (34).