Total Pageviews

Monday, August 31, 2015

Nifty Bi-Monthly Chart 1996-2015 : An Update

Nifty Index is being compiled since 02/07/1990 ; as such, a Time Frame of Bi-Monthly (Open, High, Low & Close over a period of two months for the Index) cover the full range of the Index since inception , starting August 1990 & ending on today,  in 151 candles is shown herein.


MACD (5,34,5) is not available for the first 39 candles due to default Data requirement. As such, using a zoomed view over last 117 candles fulfilling the minimum requirement :

I am sharing crucial Macd (5,34,5) data  for certain days (inclusive Milestone numbers ) ; IMHO in these higher degree Elliot Wave , Nifty had done its peak for the time being as shown by a higher Nifty with lower Macd readings.

Next candle with closing at/over 9482 shall result in the histogram being rendered positive  or we may to wait longer. 

Sunday, August 2, 2015

Silver - $/Oz : Fortnightly Chart

After a life time high in 1980's , Silver remained in bear grips over a long period.


Over the last 15 years, I observed there appears a ABC pattern in weekly chart ; as its retracement from last high of 49.79 is best to be viewed in a fortnightly chart. Accordingly, I had sourced the weekly Data from NetDania.com to an excel file & there after created a fortnightly . Here is the resultant chart with Macd (5,34,5) :

 
IMHO, Silver looks at the fag end of (B) & likely to get support from TL from 5.52-8.41 ; let us watch for termination . (C) wave is estimated to give a minimum of  61.8% of (A) { 27.97 } to a very higher value in the next up move.

Here is a closer views in a 150 candles from same Data : a wedge & double bottom is being observed.

Tuesday, June 30, 2015

Nifty Bi-Monthly Chart 1996-2015 : Observation on Macd Histogram

Further to my blog:

http://lalitlk-lalit-lk.blogspot.in/2015/06/nifty-bi-monthly-chart-1996-2015.html,

my observation on the Macd Histogram may look interesting in the sense that a cross over of the zero line were of  a gap  of 1 to 20 periods of  duration 2 months ; 2 cases of 1 (showing short duration ; inclusive just concluded ) & 2 cases of 2 :


Next table summarised value on diverse dates :


 Note that a closing of 9215 or higher on end of August 2015 may render the Histogram to a positive value. 

Nifty Bi-Monthly Chart 1996-2015

Nifty Index is being compiled since 02/07/1990 ; as such, a Time Frame of Bi-Monthly (Open, High, Low & Close over a period of two months for the Index) cover the full range of the Index since inception.  Full range Chart in 150 candles is shown herein.


Full data is being shared in FaceBook group "Daily_Nifty" as per link : 

https://excel.office.live.com/x/ExcelView.aspx?FBsrc=https%3A%2F%2Fwww.facebook.com%2Fattachments%2Ffile_preview.php%3Fid%3D1655964577958570%26time%3D1435671266%26metadata&access_token=1835286898%3AAVJSrcu7hwPKuXyQJ3Q742WoEnGe_8LGBQBeq3BMUihpmQ&title=DN_Nifty-Bi-Monthly2015.xlsx

MACD (5,34,5) is not available for the first 39 candles due to default Data requirement. As such, using a zoomed view over last 113 candles fulfilling the minimum requirement :


I am sharing crucial Macd (5,34,5) for certain days (inclusive first 2K etc) ; IMHO in these higher degree Elliot Wave  Nifty had done its peak for the time being as shown by a higher Nifty with lower Macd readings.


Tuesday, June 16, 2015

CNX NIFTY INDEX Time Frame : Cycles of 21 days - Update # 2

Here I have up dated my views on my earlier blog entitled :
http://kolkatabull.blogspot.in/2015/03/cnx-nifty-index-time-frame-cycles-of-21.html


IMHO, for the wave originating from 920 (October 2002), top had been made at 9119, based on Elliot Oscillator aka Macd (5,34,5) . Here is a list of the some crucial points & corresponding values.


Tuesday, June 9, 2015

MSCI India : with RONW analysis

MSCI_Index is closely followed by FII's
comprised of SENSEX ( but for Axis, HDFC Bank & Maruti) & others. On a recent review with RONW , it was found that out of 71 constituents, 27 entities (with a cumulative weight of 28.31%) were not earning 12% in RONW and may be considered to be EVA negative. Further, 14 constituents  (with a cumulative weight of 29.73%) were a bit better with  earning in the range of  12-15% in RONW.

Rest 30 are truly BLUE CHIPS yielding 15% or more in RONW & are may be classified to be Economic Value Adders :


Book value  & trailing 12 Months EPS were sourced from Screener.in

Friday, May 29, 2015

How to create a Diverse Time Frame Chart : An Innovative Idea

Why  do one need  a "Diverse Time Frame"  ?

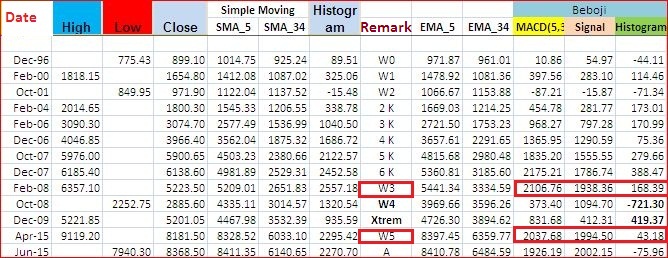
It is seen that for 'Elliot Wave Oscillator" to be studied properly , for high-low, number of candles in a chart should be in the range of 120-150 .

http://www.tradingfives.com/articles/elliott_oscillator.htm

For the instant case (UPL) from a low 101.55 (daily candle #267, date 13/11/12) to high 568.4 (daily candle #922, date 26/05/15) number of candles is found to be 655. From sourced (NSE) data , available since 24/10/2011, I decided to go for a  6 Days Cycle based on that.
   
The excel is being shared in group "Daily_Share" in Facebook platform :

Go to: (May consider "copy & paste in a browser" if it does not open here)

https://excel.office.live.com/x/ExcelView.aspx?FBsrc=https%3A%2F%2Fwww.facebook.com%2Fattachments%2Ffile_preview.php%3Fid%3D923353207710314%26time%3D1432954300%26metadata&access_token=1835286898%3AAVJnD-aryKilTCYqdi1HJyNmB5RJezY5Ng95Nlk6HIsAgQ&title=DS_UPL_TF_6DC.xlsxhttps://excel.office.live.com/x/ExcelView.aspx?

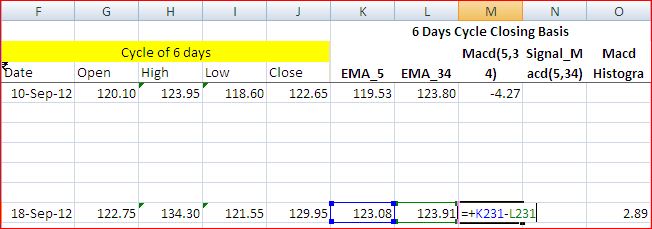
Step # 1 : First source OHLC data from any source ; copy relevant date in cells F,G, H , I (use function" Max")  ,J (use function" Min" ) & K from a set of data , e.g., 


Step # 2 : Write in formula for EMA_5 in Cell K in row 33, e.g.,


Step # 3 : Write in formula for EMA_34 in Cell L in row 207, e.g.,

Step # 4 : Write in formula for MACD  in Cell M in row 207, e.g.,


Step # 5 : Write in formula for MACD_Signal  in Cell N in row 231, e.g.


Step # 6 : Write in formula for MACD_Histogram  in Cell O in row 231, e.g.


Step # 7 :  Finally copy suitably full range inclusive BLANKS & paste to cover the full range of your Data Use excel to create your desired Chart , e.g., 

O(pen)H(igh)L(ow)C(lose)

Step # 8 :   Use excel to create your desired other Chart , e.g., 
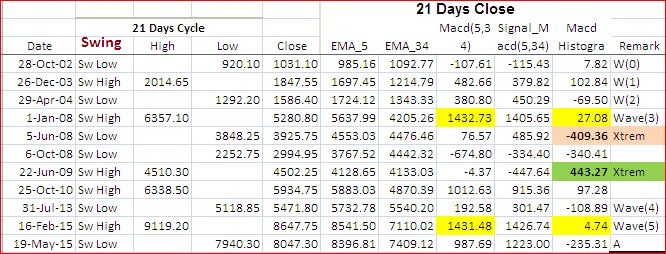
MACD (5,34,5)